View Simulation Results: Transcripts, Scores, and Analytics
Read simulation results in Future AGI: view conversation transcripts, evaluation scores, performance analytics, and call logs for each agent run.
About
After a simulation test runs, the results are available in the test detail view. You can see every conversation transcript, evaluation scores per call, aggregated analytics across all runs, and detailed per-call metrics including latency, token usage, and cost.
Test Detail View
When you open a completed test, you see three tabs:
Simulated Runs
A list of all test executions. Each execution represents one run of the test. Click an execution to see its individual call results.
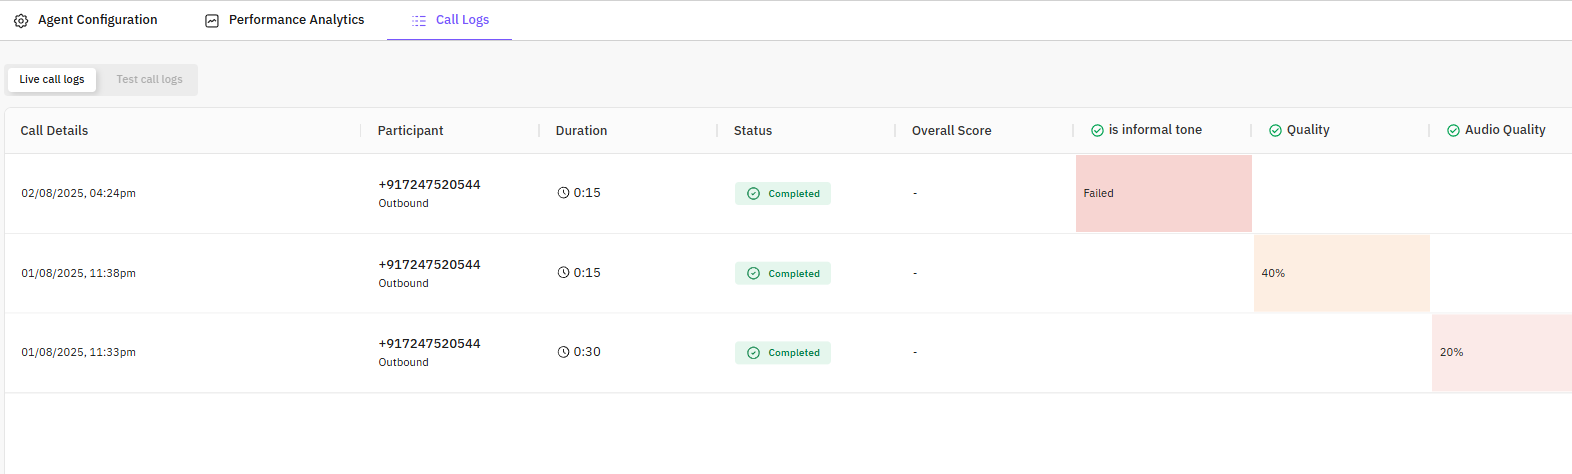
Logs
Every call execution for this agent. Each row shows call information (duration, participants, status), and evaluation scores when the run had evals configured. You can filter by version to see only calls that used a specific agent version.
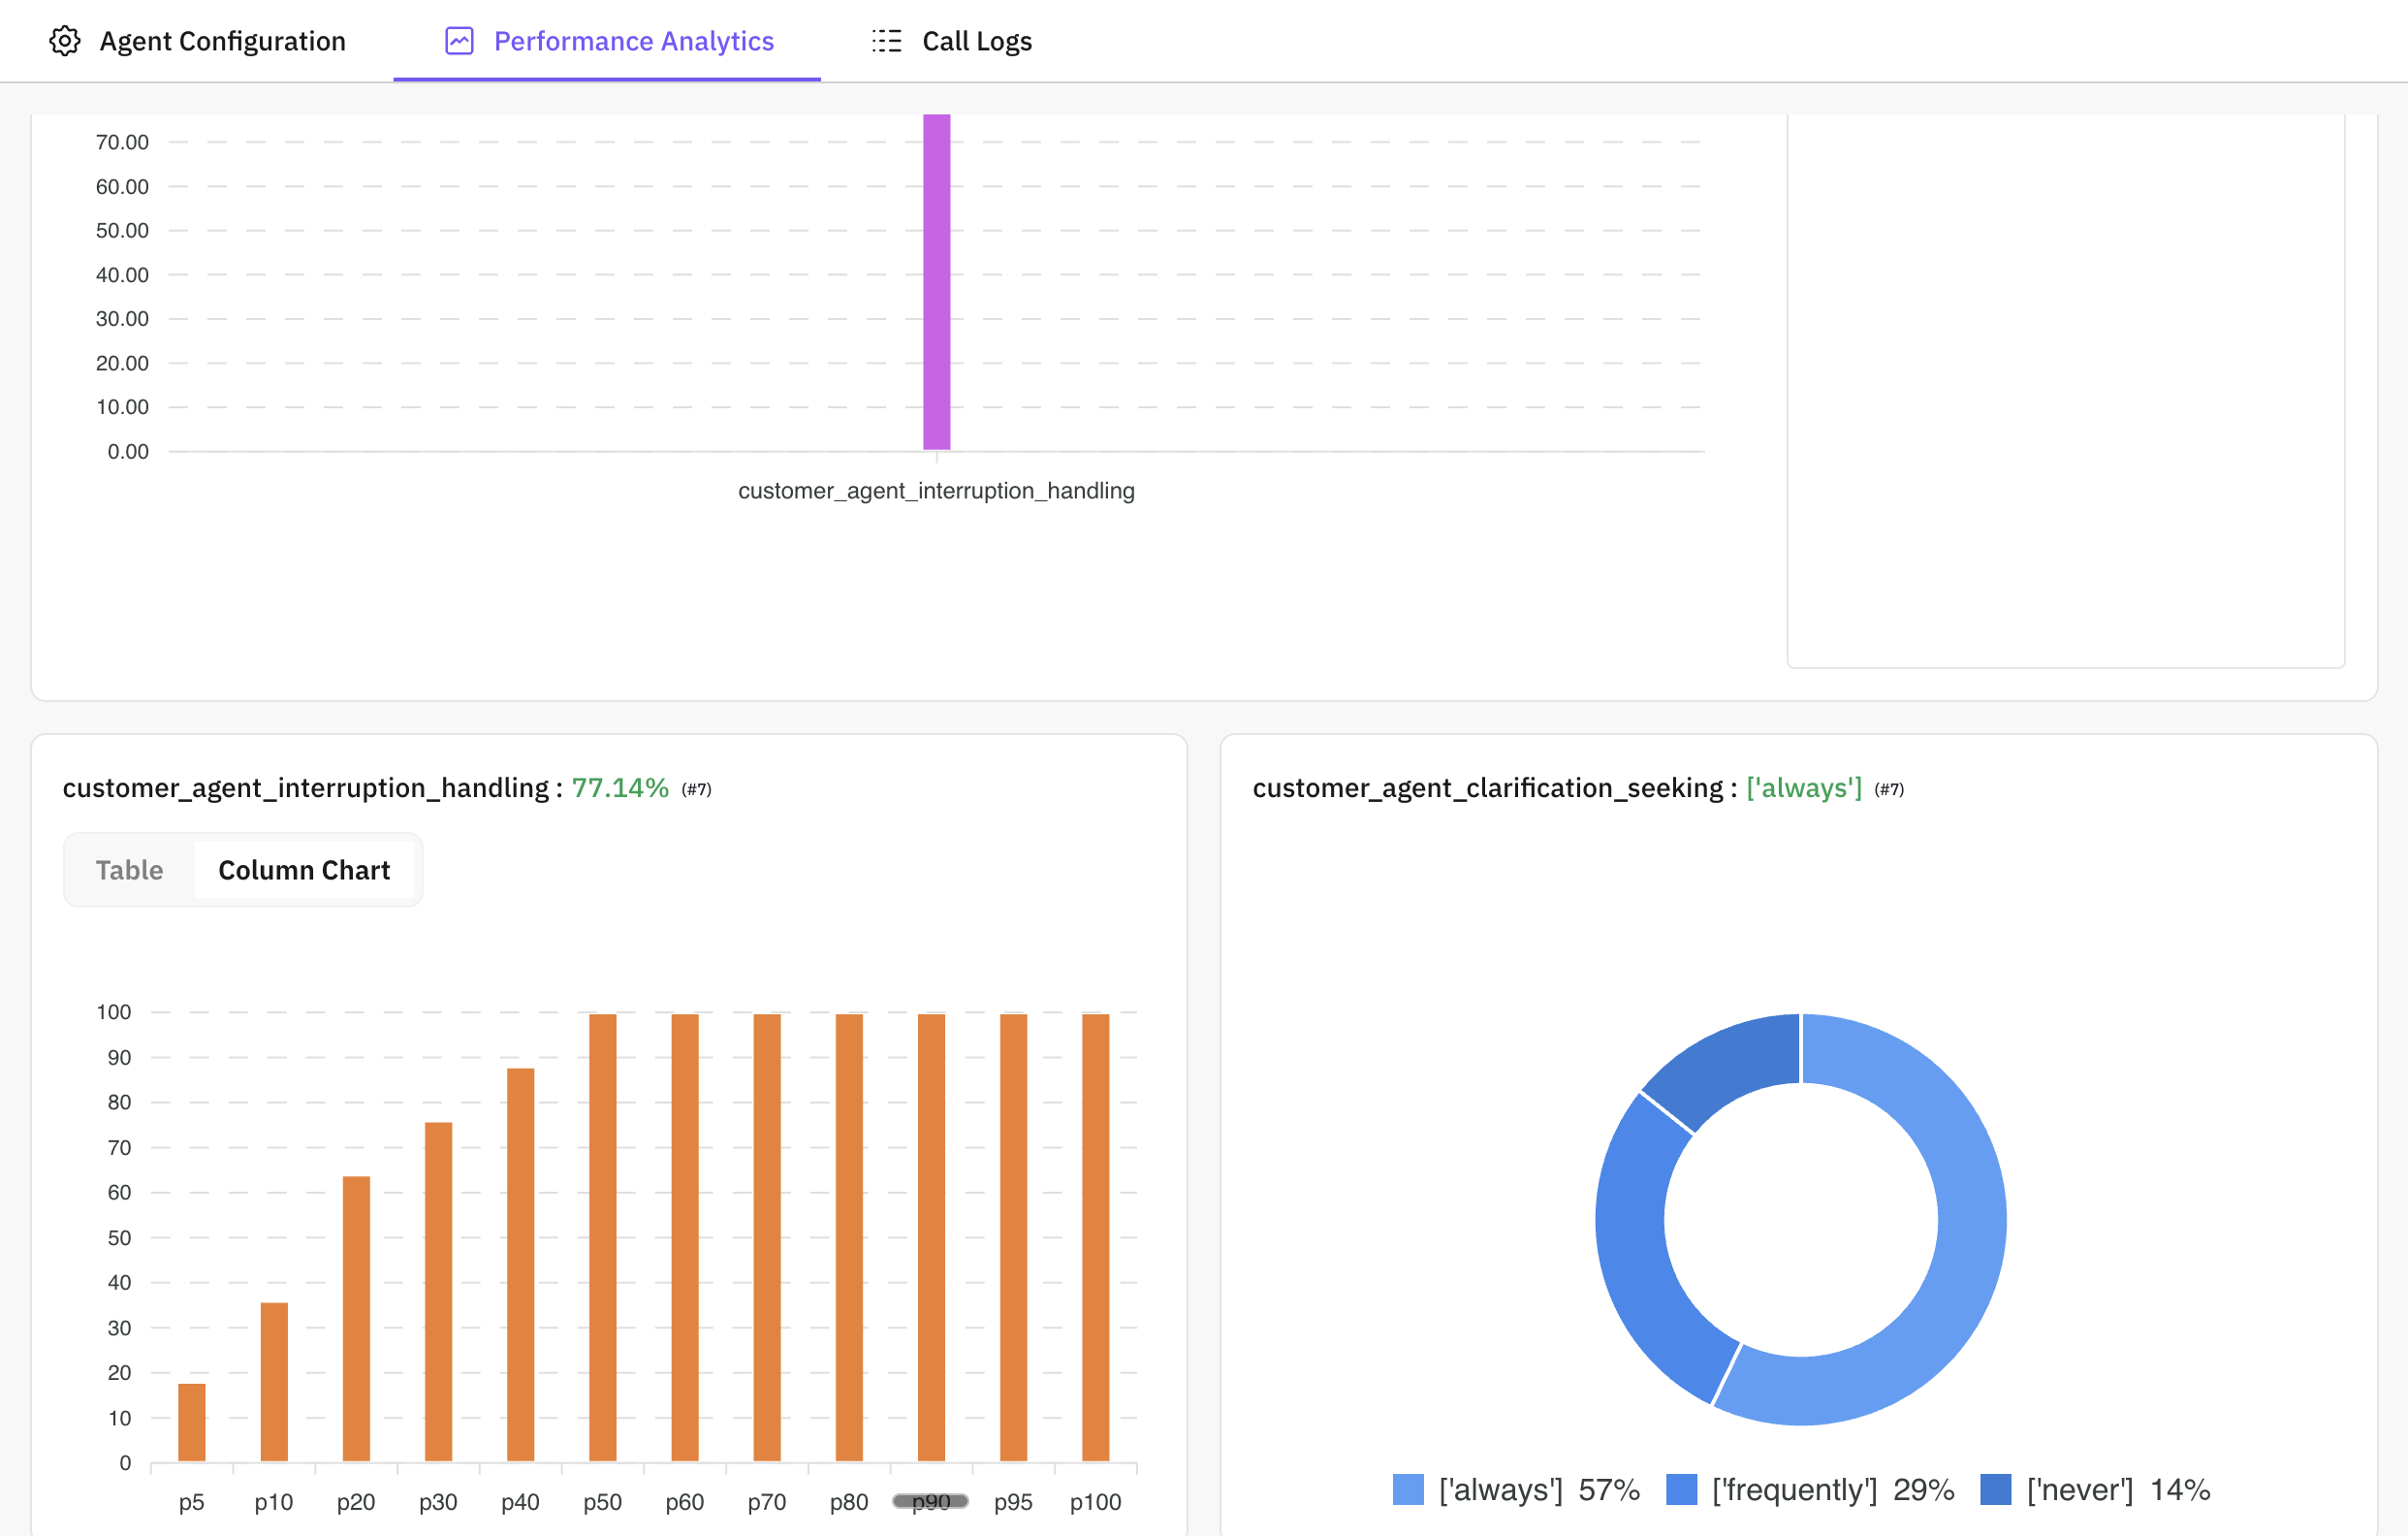
Analytics
Performance analytics showing how your agent performed across test runs:
- Call success rate: Proportion of calls that completed successfully vs failed or cancelled
- Average response time: How long the agent typically takes to respond
- Evaluation scores: Scores by eval metric (correctness, tone, compliance) so you can see which areas are strong or weak
- Error rate: How often calls fail or hit errors
Use this to track performance over time, compare across versions, and spot regressions before shipping.
Inspecting a Call
Open the call list
Go to the Logs tab. Optionally filter by version using the version selector.
Open call detail
Click a call in the list. A call detail view opens with the full conversation and results.
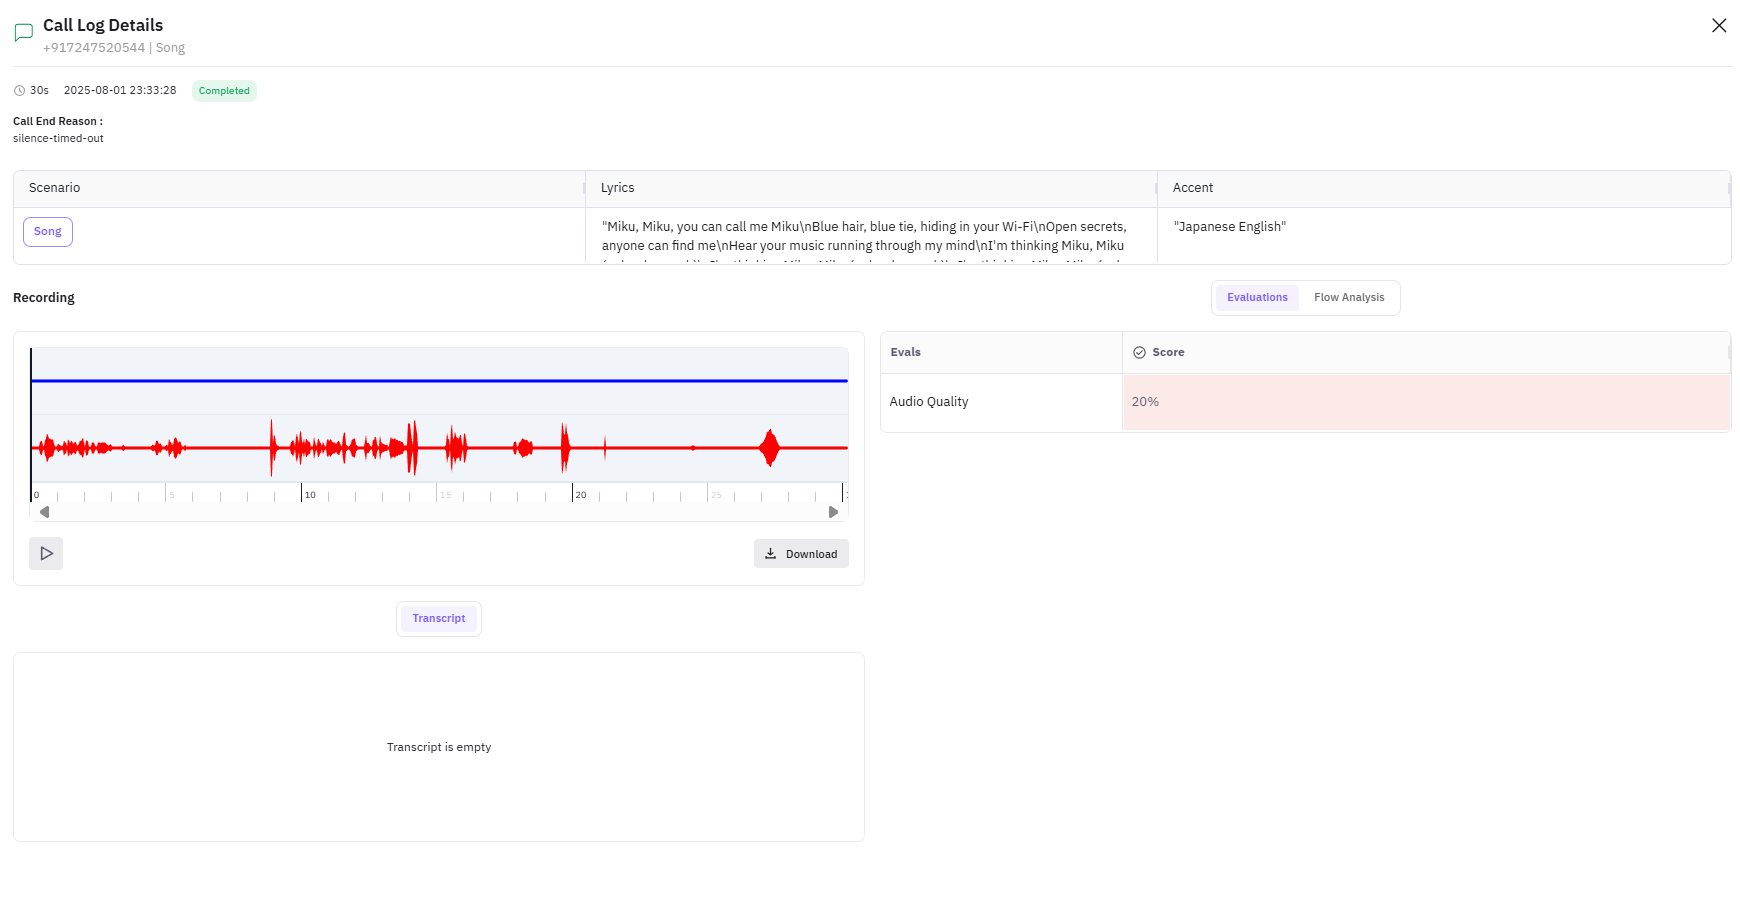
Review transcript and evals
In the call detail you get:
- Full transcript: Turn-by-turn conversation between agent and simulated customer
- Evaluation results: Scores per metric for this specific call
- Audio playback: When available for voice simulations
- Cost breakdown: Token usage and cost for this call
- Trace information: Detailed tracing data if observability is enabled (see Observe)
Execution Detail
Click on a specific execution from the Simulated Runs tab to see detailed results.
Call/Chat Details
The main view shows every conversation in this execution with transcripts, metadata, evaluation scores, and conversation flow visualization.
Analytics
Performance metrics for this specific execution:
- Latency distribution
- Token usage
- System metrics
- Evaluation score breakdown by metric
Optimization Runs
If you’ve run Fix My Agent or other optimizations on this execution, they appear here with their status and results.
Side Drawer
Clicking on a specific call opens a detail drawer showing:
- Scenario details for this call
- Evaluation results grid with pass/fail per metric
- Poor evaluations highlighted
- System metrics (latency, tokens)
- Cost breakdown
- Call analytics summary
- Trace information
- Baseline comparison option (compare against a previous version’s results)
Next Steps
Questions & Discussion