What it is
Every annotation queue includes a built-in analytics dashboard that shows progress, throughput, and quality metrics. Use it to monitor how your annotation campaign is going and to identify issues before they compound.Accessing analytics
Open a queue and click the Analytics tab.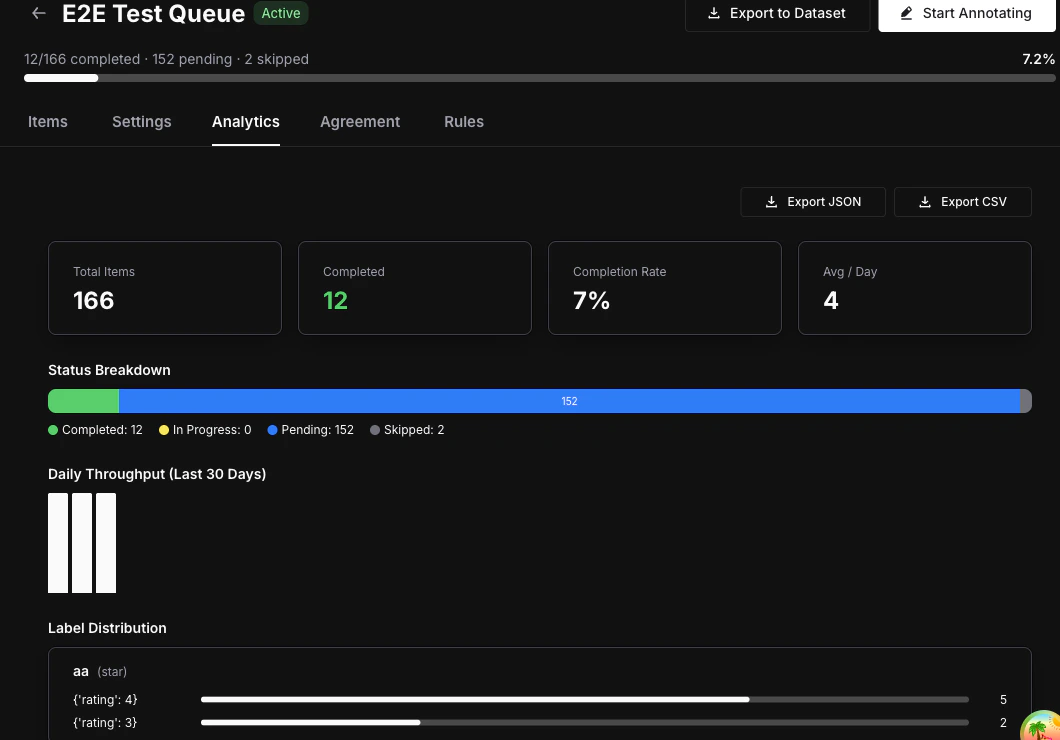
Overview stats
The top of the analytics view shows four key numbers at a glance:- Total items — Number of items currently in the queue.
- Completed — Number of items that have been fully annotated.
- Completion rate — Percentage of items completed out of the total.
- Average completions per day — Rolling daily throughput across the queue’s lifetime.
Status breakdown
A visual bar displays the distribution of item statuses:- Completed (green) — All required annotations collected.
- In Progress (blue) — At least one annotation submitted, more required.
- Pending (gray) — No annotations yet.
- Skipped (orange) — Annotator chose to skip the item.
Daily throughput chart
A bar chart showing the number of completions over the last 30 days. Use it to spot trends, identify slowdowns, and measure annotator velocity over time.Annotator performance table
| Column | Description |
|---|---|
| Annotator | Name and email of the team member |
| Completed | Number of items this annotator has completed |
| Last Active | Timestamp of their most recent annotation |
Label distribution
For each label attached to the queue, the analytics view shows the frequency of each value:- Categorical — Option counts (e.g., “Positive: 45, Negative: 23, Neutral: 12”).
- Numeric / Star — Distribution histogram across the value range.
- Thumbs — Up vs. down counts.
- Text — Total annotation count (text values are not aggregated).
Inter-Annotator Agreement
Switch to the Agreement tab to see consistency metrics between annotators scoring the same items. Metrics used:- Cohen’s Kappa — Used when exactly 2 annotators have scored the same items.
- Fleiss’ Kappa — Used when 3 or more annotators have scored the same items.
| Kappa Value | Interpretation |
|---|---|
| < 0.20 | Poor |
| 0.21 — 0.40 | Fair |
| 0.41 — 0.60 | Moderate |
| 0.61 — 0.80 | Substantial |
| 0.81 — 1.00 | Almost perfect |
Agreement metrics require
annotations_required to be set to 2 or more in your queue settings, and at least 2 annotators must have scored the same items for results to appear.Next steps
Export Annotations
Export completed annotations as datasets for fine-tuning or evaluation.
Annotate Items
Learn the annotation workspace and keyboard shortcuts.
Queues Concept
Understand queue architecture, assignment modes, and lifecycle.