Review guardrail activity
Read a guardrail's trigger volume and latency, then correct a verdict it got wrong from the request log.
Guardrails fire on every request that matches their rules, and four surfaces tell you how that’s going: the Analytics tab for volume and latency, the Logs tab for the individual requests that triggered a check, the request drawer for correcting a verdict a guardrail got wrong, and the Feedback tab for accuracy over time. This guide walks through all four.
This assumes Agent Command Center, where Protect’s guardrails live under Gateway, is already set up with at least one provider connected. If it isn’t yet, start with the Agent Command Center Quickstart. It also assumes you already have a guardrail turned on and that it’s fired on at least one request. If not, turn on a guardrail first, then come back once it’s had a chance to fire. Until it does, the trends chart, rules table, Logs tab, and Feedback tab covered below all show empty states instead of data.
Check trigger volume in Analytics
Go to Gateway > Guardrails > Analytics. A range toggle switches the whole tab between 24h, 7d, and 30d, so start by picking the window you care about.
Four numbers sit at the top. Together they say how often guardrails are firing, what they did when they fired, and what that cost in latency:
| Metric | What it measures |
|---|---|
| Trigger Rate | Percentage of requests in the range where any guardrail triggered |
| Blocked | How many checks blocked, not requests (a request with two blocking checks counts twice) |
| Warned | How many checks warned, not requests (a request with two warning checks counts twice) |
| Avg Latency | Average latency added by the guardrail check itself, not the total request latency |
Below the numbers, the Guardrail Triggers Over Time chart plots trigger volume across the selected range, so you can spot a spike or a change in behavior.
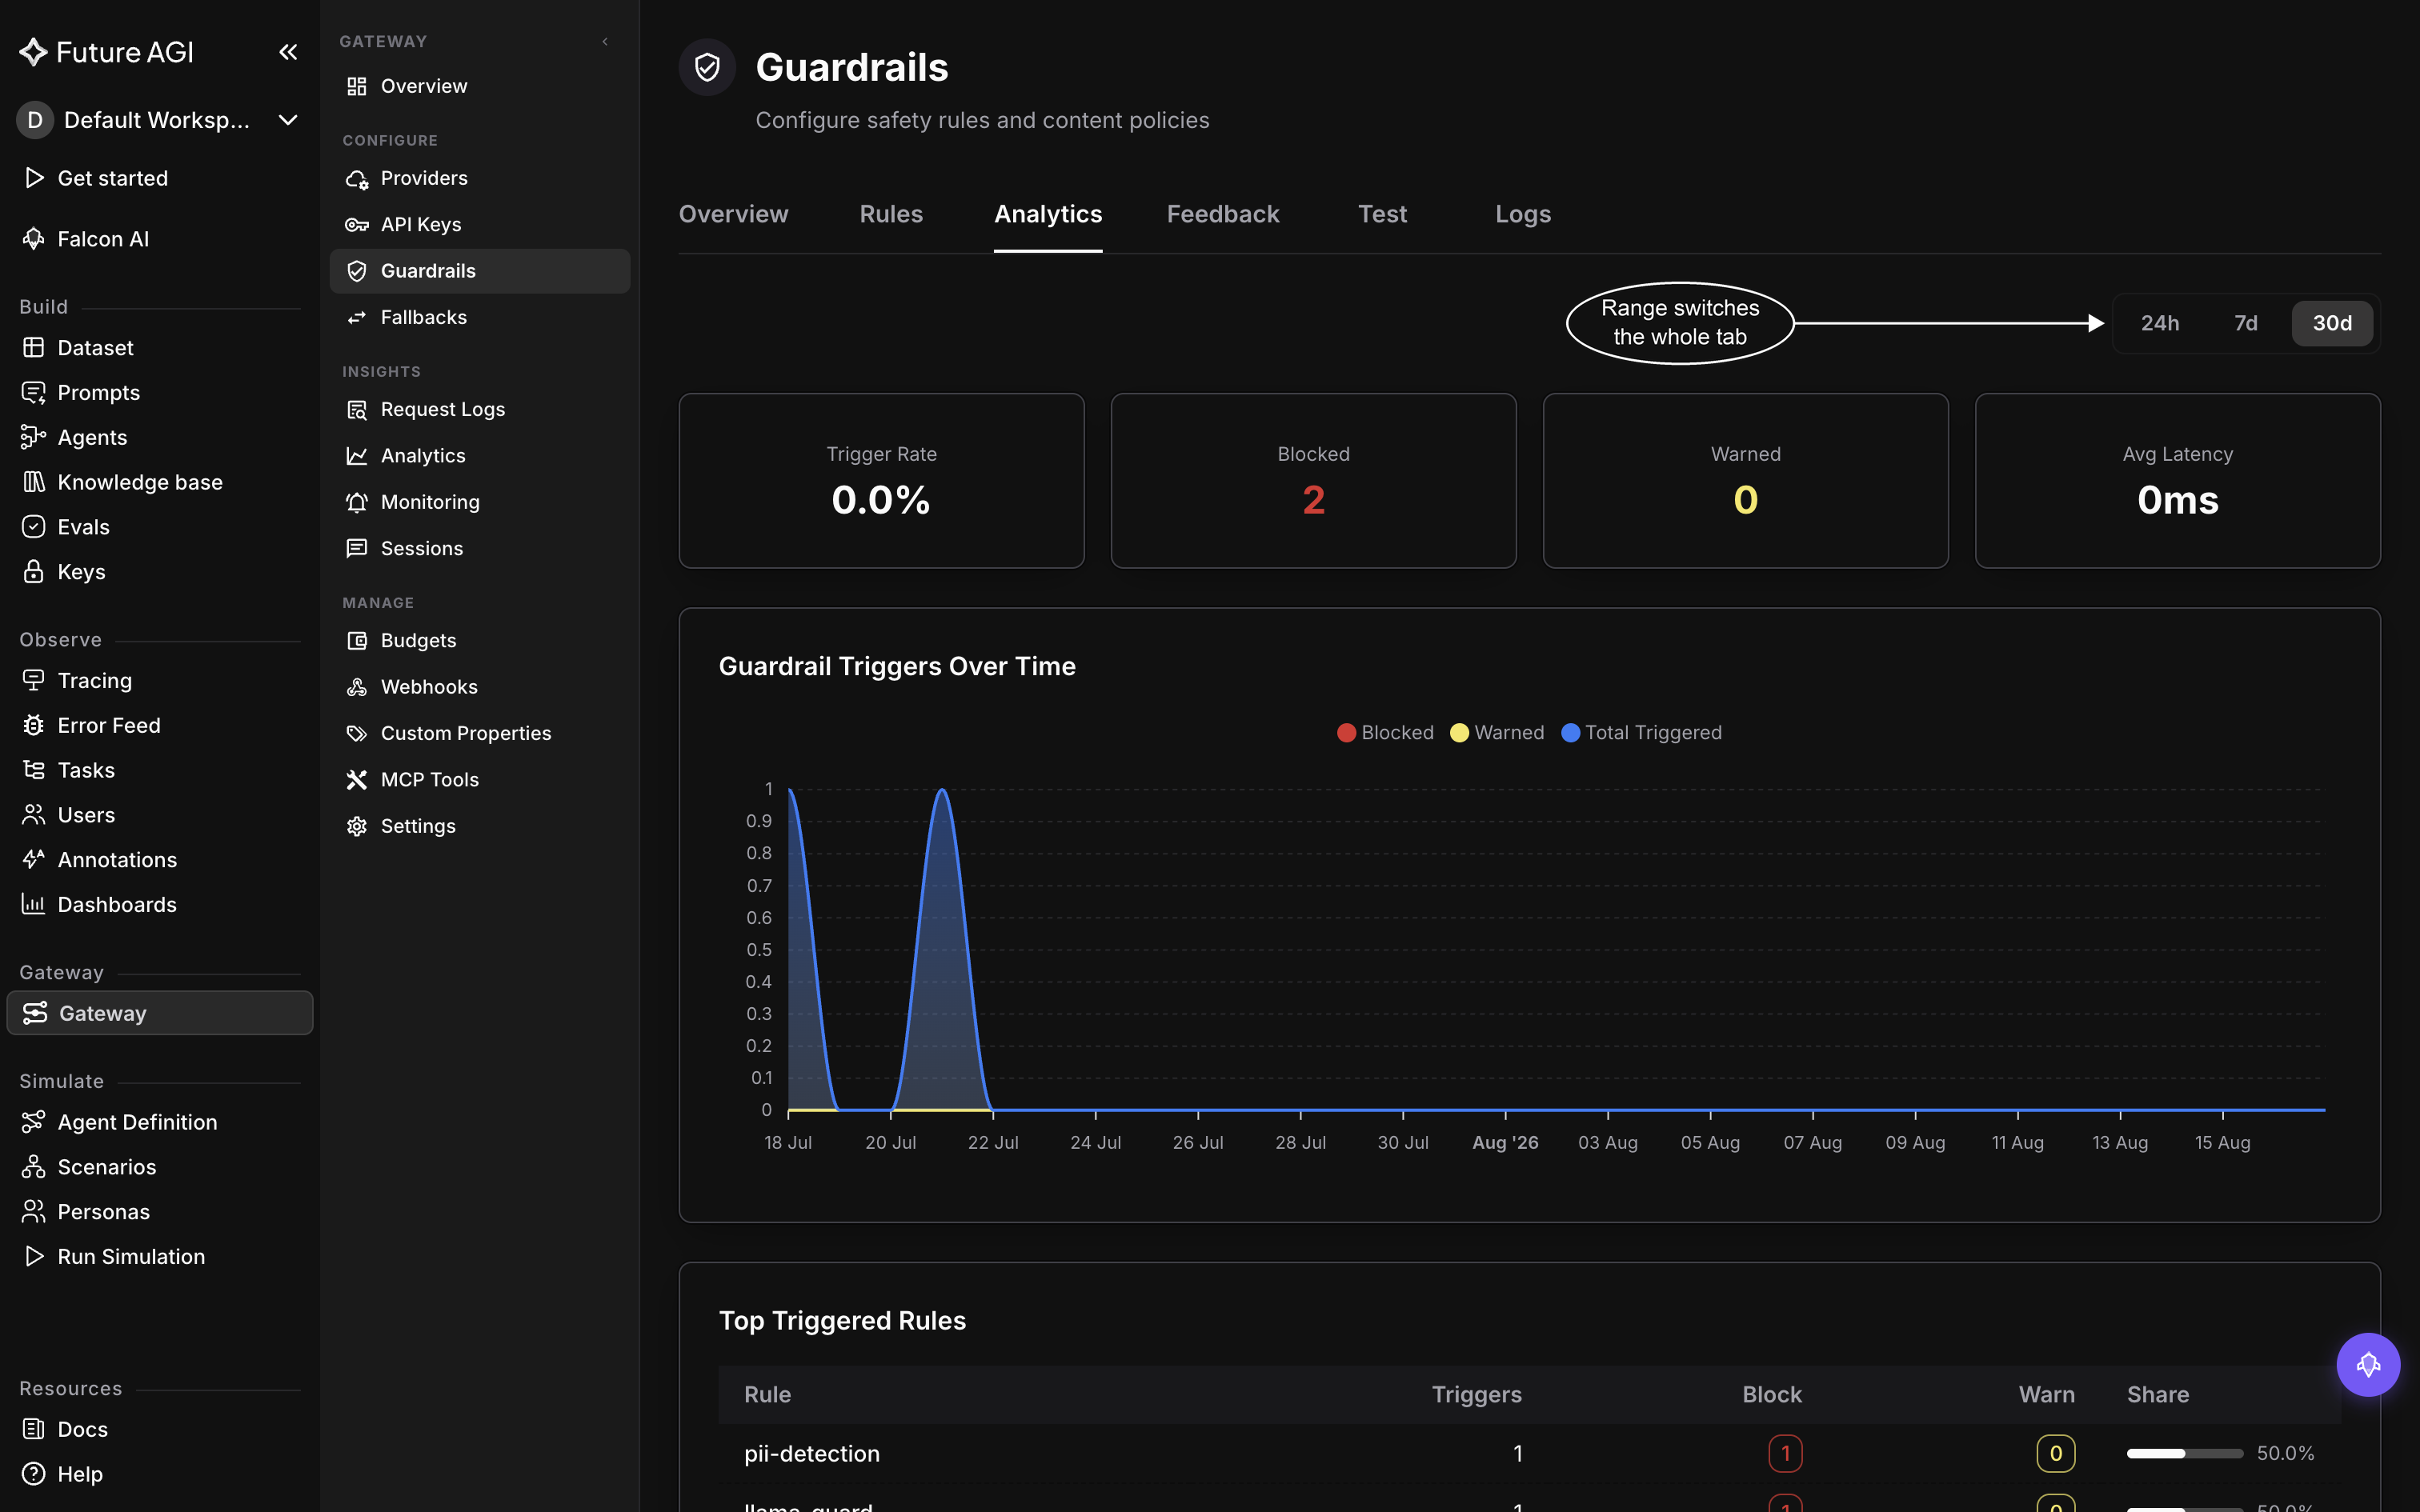
Trigger Rate is a share of every request, not a count, so a couple of blocks against a month of traffic still rounds to 0.0%
The Top Triggered Rules table breaks that volume down by rule. Use it to see which check is driving the volume, and whether that check is mostly blocking or mostly warning. One rule taking up most of the Share is usually the one worth investigating first, and that’s what the next section walks through.
Find the requests in Logs
Once you know which check is generating volume, go to Gateway > Guardrails > Logs to see the actual requests it fired on. This isn’t scoped to the check you picked in Top Triggered Rules; it lists recent guardrail-triggered requests across the gateway.
Click a row to jump to that request in the Gateway request logs, the dashboard’s full log of request traffic rather than a guardrail-specific view. Click the request there to open its detail drawer.
Correct a verdict in the request drawer
The request’s detail drawer is where you tell Future AGI whether the guardrail got it right. The feedback controls sit on the drawer’s Guardrails tab, with one set per check that fired, so a verdict attaches to a specific check rather than to the request as a whole. Mark the verdict as one of Correct, False Positive, False Negative, or Unsure. Add a comment if you want to note why, then press Submit Feedback. Edit is available right after you submit.
Feedback is recorded and summarized. It does not change how the check behaves: submitting a False Positive doesn’t loosen the rule or stop it from firing on similar requests going forward. To actually stop a guardrail from misfiring, see Guardrail fires on the wrong requests.
See accuracy in Feedback
Go to Gateway > Guardrails > Feedback. Everything submitted from request drawers rolls up there, in the Feedback Summary by Check card. It shows totals and accuracy per check, so you can see which checks your team is marking correct most often and which ones are drawing false positives or false negatives.
Dive deeper
Questions & Discussion