Run & Monitor Agent Workflows
Execute AI agent workflows, watch per-node status in real time, inspect input/output data for each step, and browse full execution history.
About
Run your workflow and monitor each step as it executes. The platform shows real-time status per node, records full input/output data, and keeps a history of all past runs.
Run a Workflow
Open the builder
Navigate to your graph and open the Build tab. Make sure all nodes are configured. The platform highlights unconfigured nodes with a red border.
Click Run
Click the Run button (play icon) in the builder actions on the right side of the canvas.
- If you are on a draft version: the platform validates the graph, prompts you to save, and then activates and executes the workflow.
- If you are on a non-draft version: the workflow executes immediately.
Validation checks for:
- All nodes are fully configured
- No cycles in the graph
- All required ports are connected
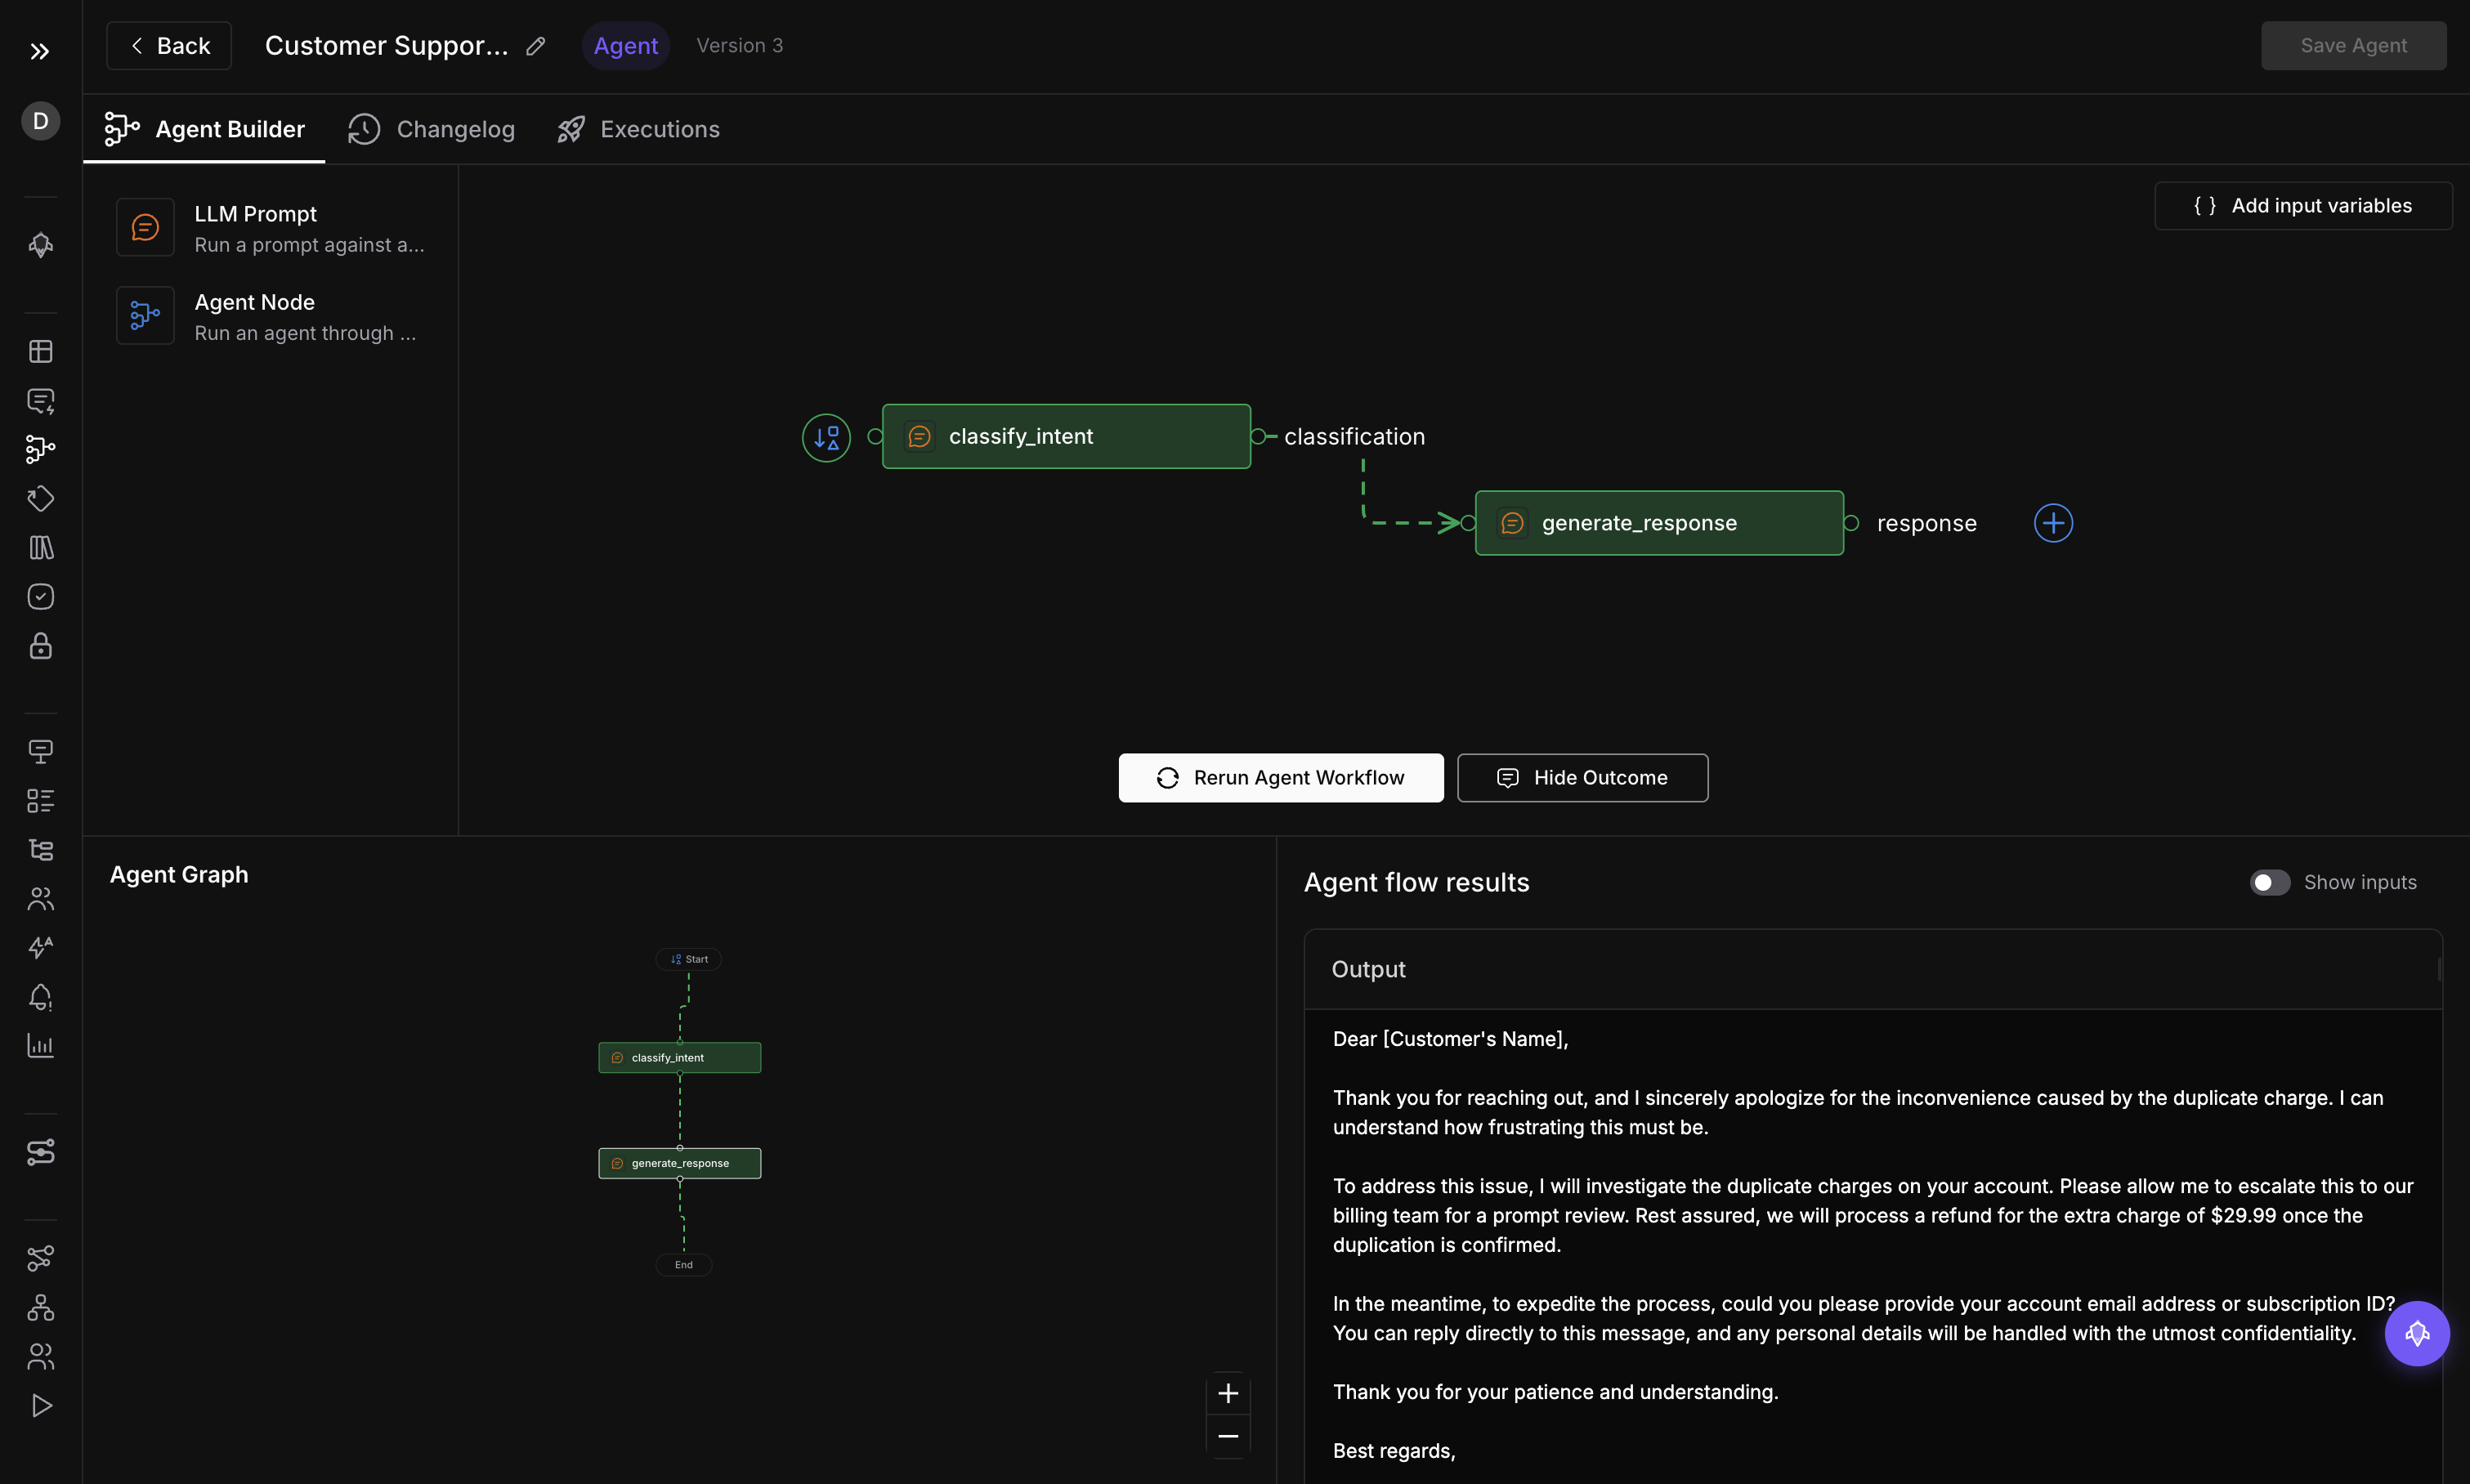
Watch the execution
The Run Agent Panel opens at the bottom of the builder. Nodes update in real time as they execute:
- Green animated border: node is currently running
- Green solid border: node completed successfully
- Red border: node failed
- Gray: node is pending or was skipped
Edges animate to show data flowing between nodes.
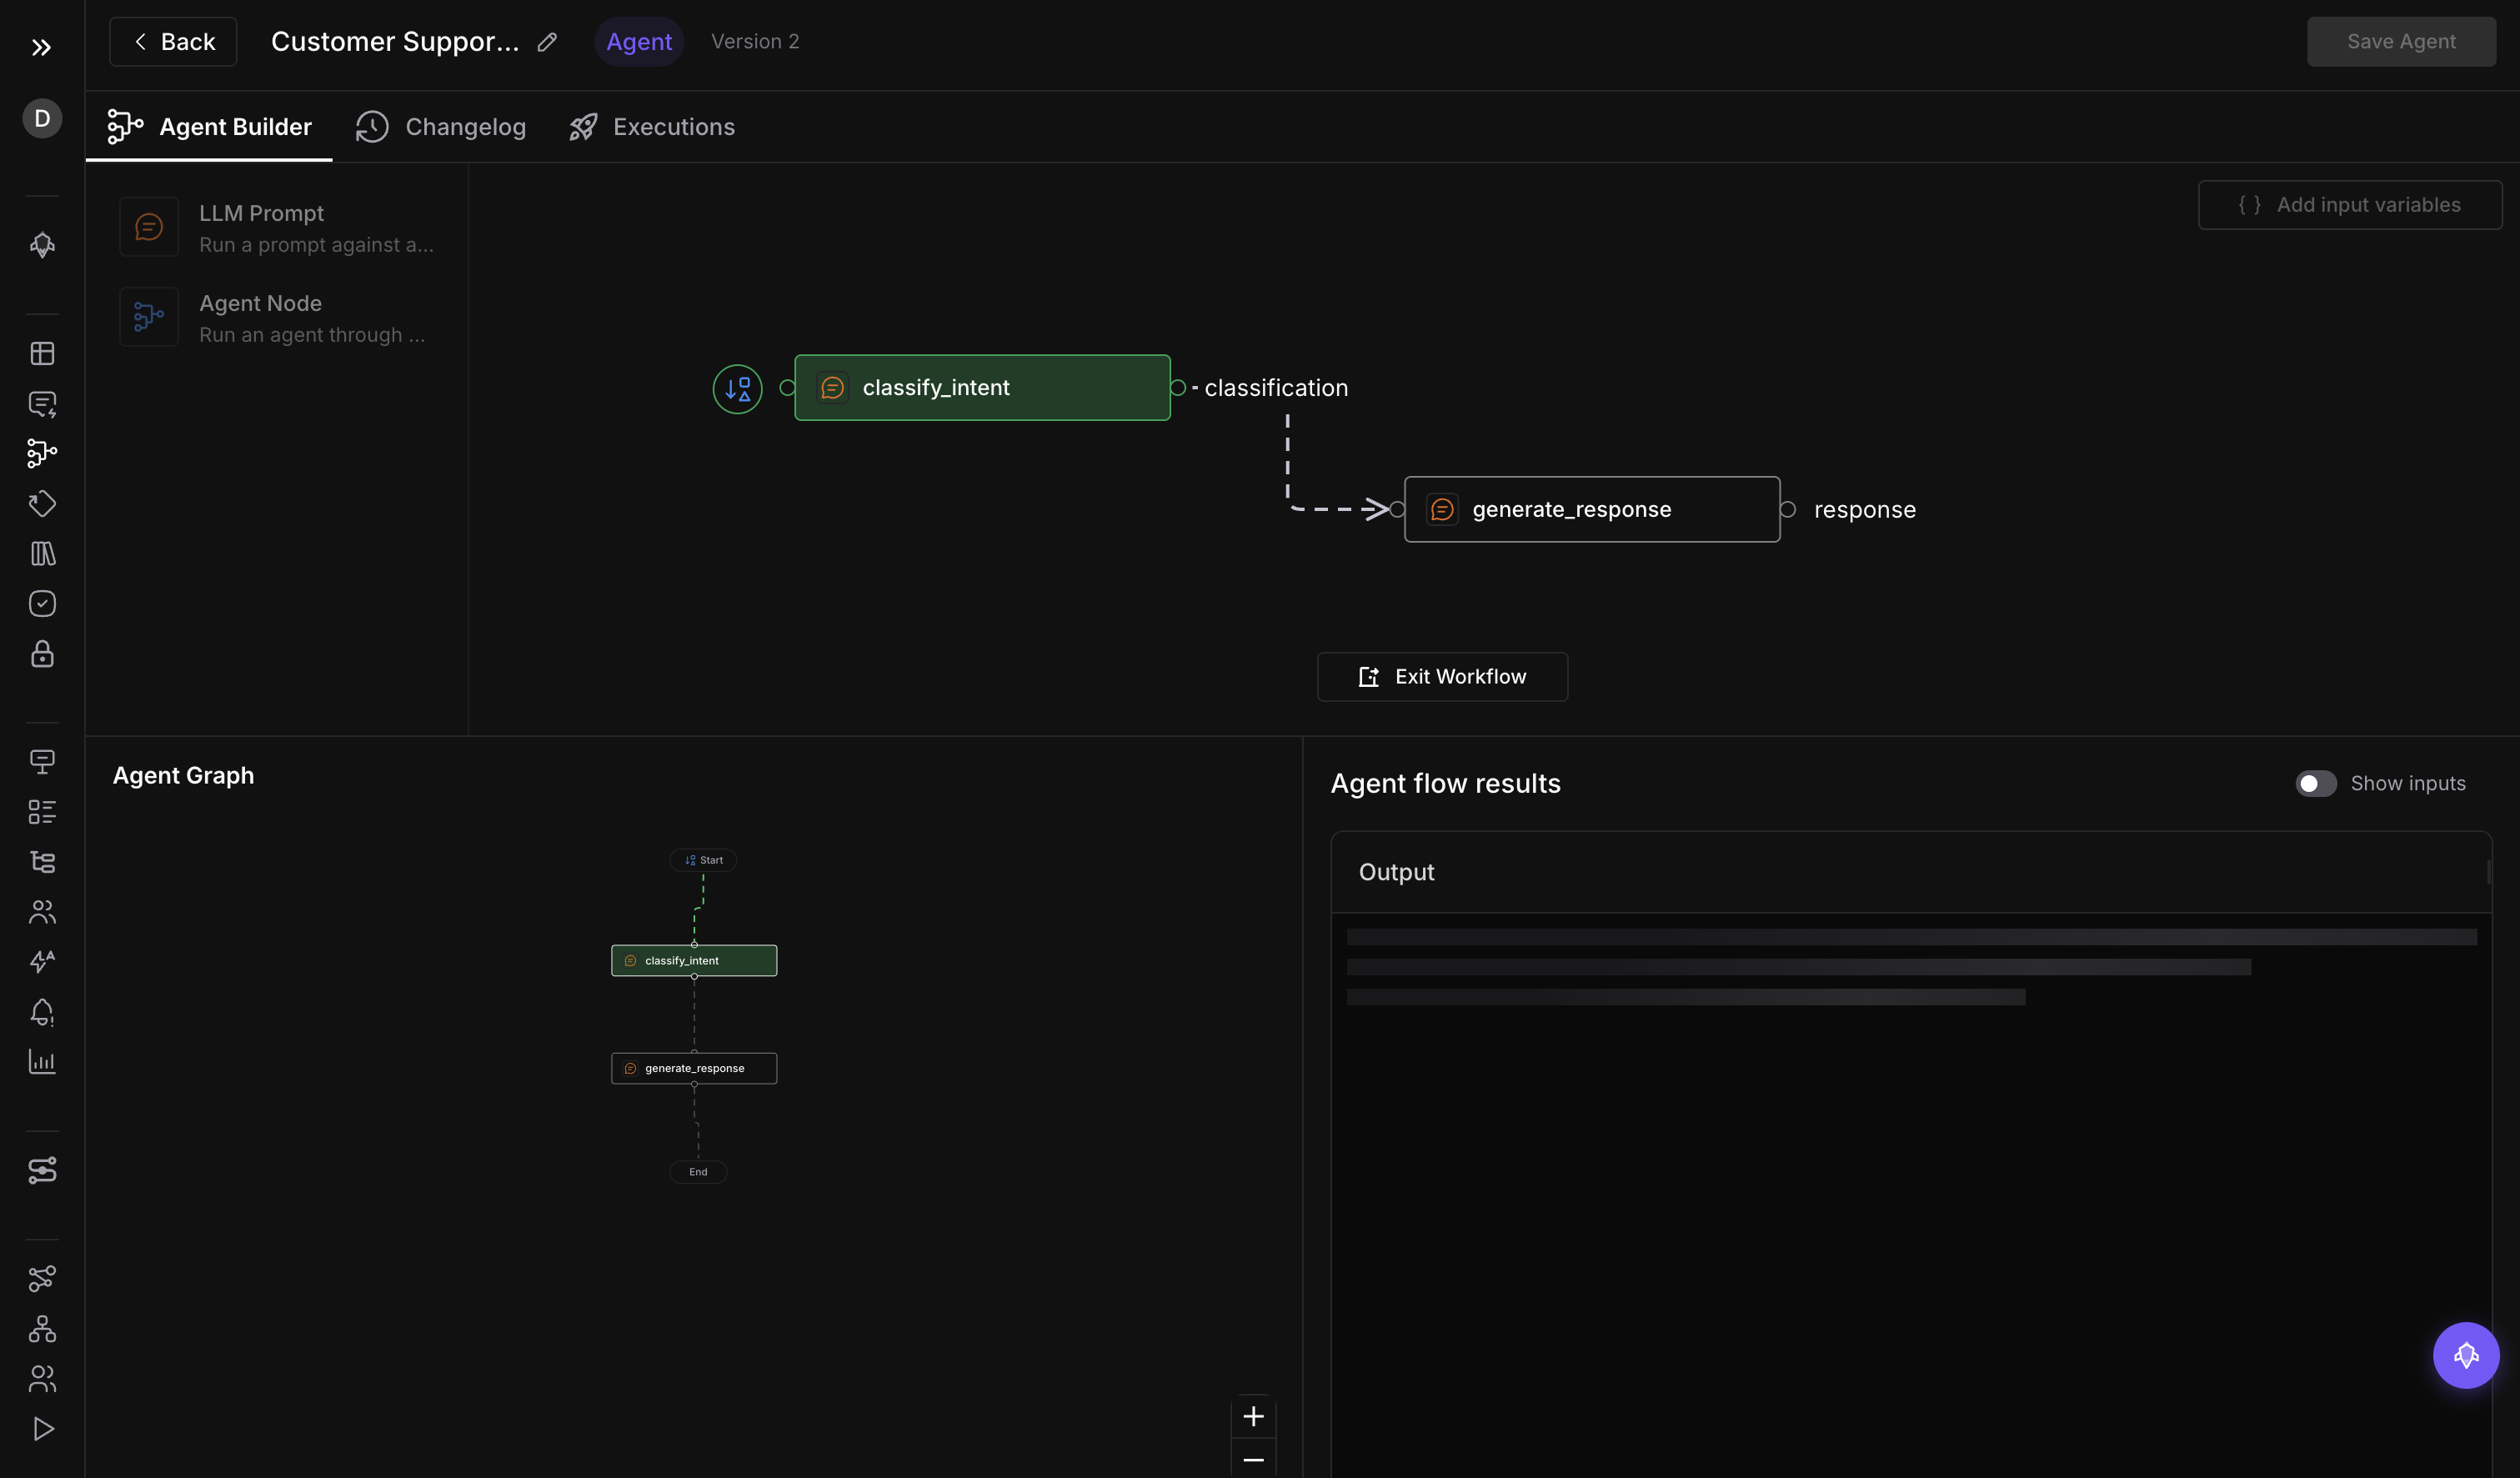
View Execution Results
The Run Agent Panel at the bottom of the builder shows detailed results after (and during) execution.
The panel is split into two halves:
Left: Graph Visualization
A miniature view of your graph with nodes colored by execution status:
- Green = success
- Red = failed
- Gray = pending or skipped
Click any node in this view to inspect its details on the right.
Right: Node Output Details
Shows the selected node’s execution data:
| Field | Description |
|---|---|
| Execution ID | Unique identifier for this node’s execution |
| Status | Success, failed, skipped, running, or pending |
| Duration | How long the node took to execute |
| Input Data | The data received from upstream nodes |
| Output Data | The data produced by this node (JSON or text) |
| Error | Error message and details (if the node failed) |
The panel auto-selects the last executed node when the workflow completes.
Execution History
The Executions tab shows a complete history of all runs for this graph.
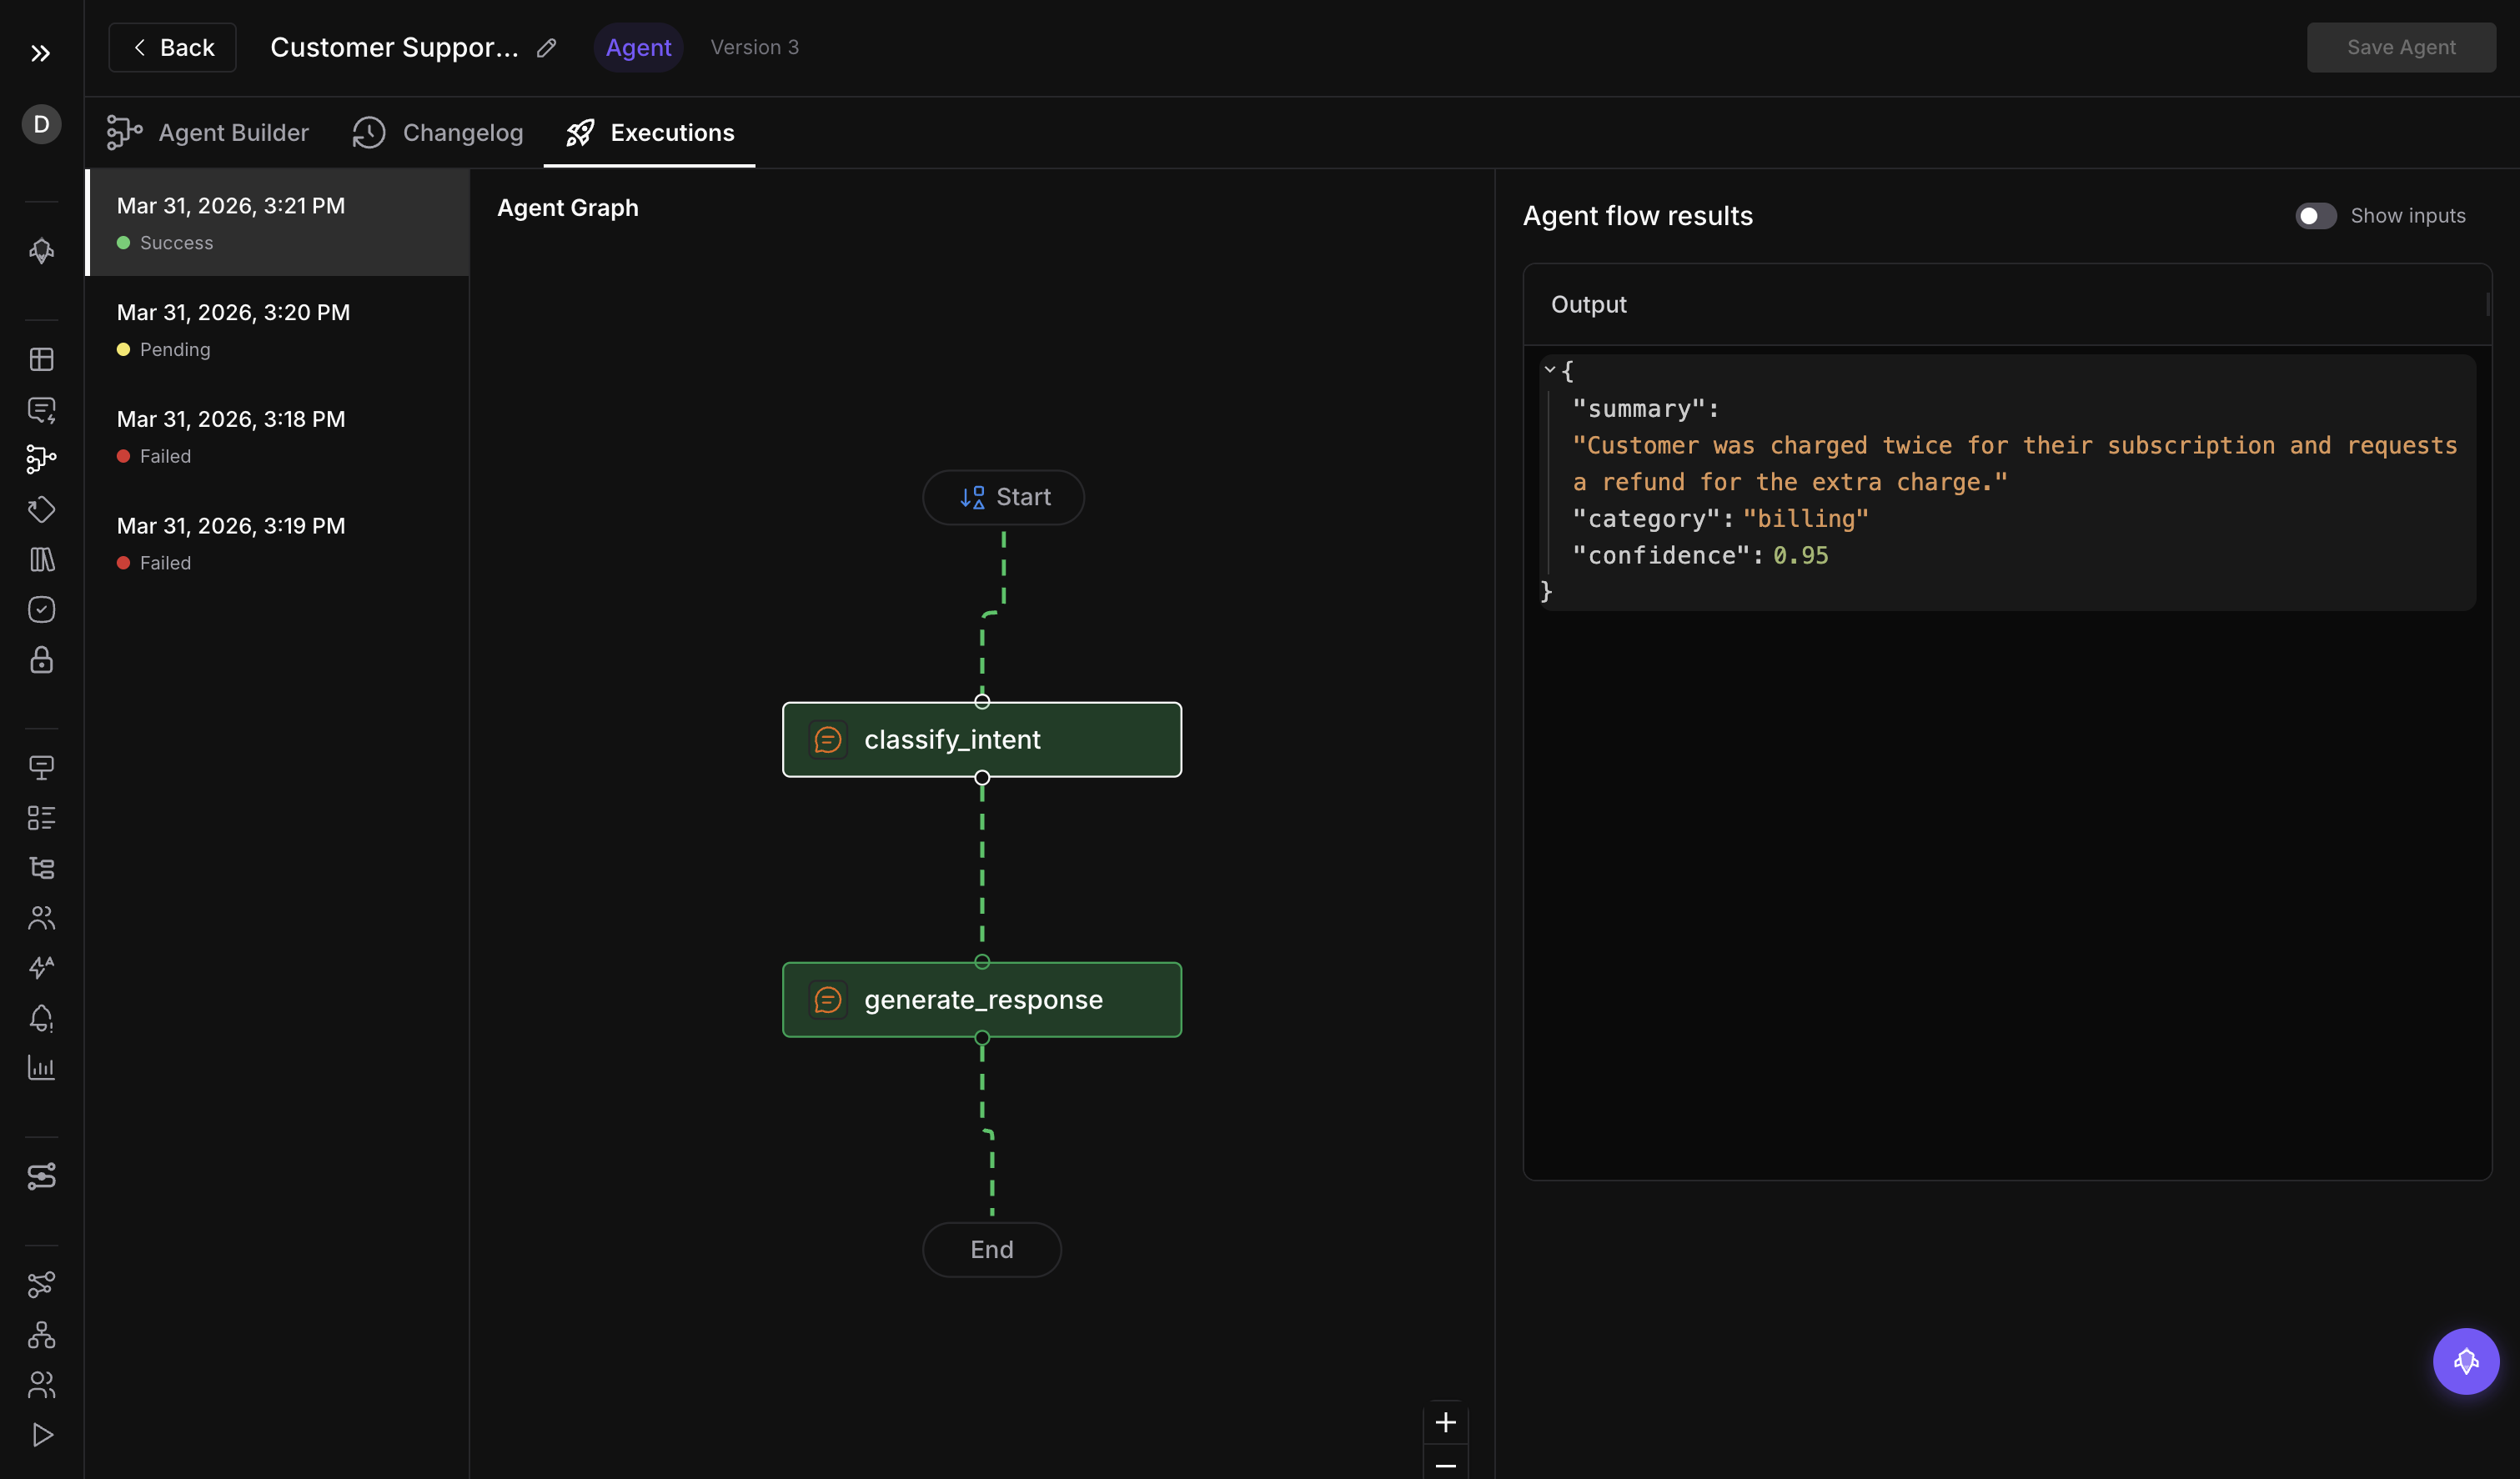
Browse Executions
The left sidebar lists all executions, most recent first. Each entry shows:
- Timestamp
- Status badge (success, failed, running, pending)
- Version used
Click an execution to load its details on the right. The same graph visualization and node output panel from the builder.
Inspect a Past Execution
Select any execution to see:
- The full graph with per-node status colors
- Click individual nodes to see their input data, output data, timing, and errors
- Compare different executions to understand how changes affected results
Next Steps
- Build a Workflow: Modify your workflow and add more nodes
- Create a Graph: Create another graph or manage versions
- Versions & Execution: Understand the execution model in depth
Questions & Discussion