Using Error Feed
How to read scores, insights, clusters, and recommendations from Error Feed.
About
Once traces are flowing into an Observe project, Error Feed automatically analyzes them and surfaces errors, scores, and recommendations. This page explains how to read and act on the results. Error Feed works with any integration that sends traces. No additional setup is needed.
For full end-to-end examples with code, see the Error Feed cookbooks.
Viewing Results
Open your project in the Observe tab and click on a trace. Error Feed insights appear in a collapsible accordion at the top of the trace detail view.
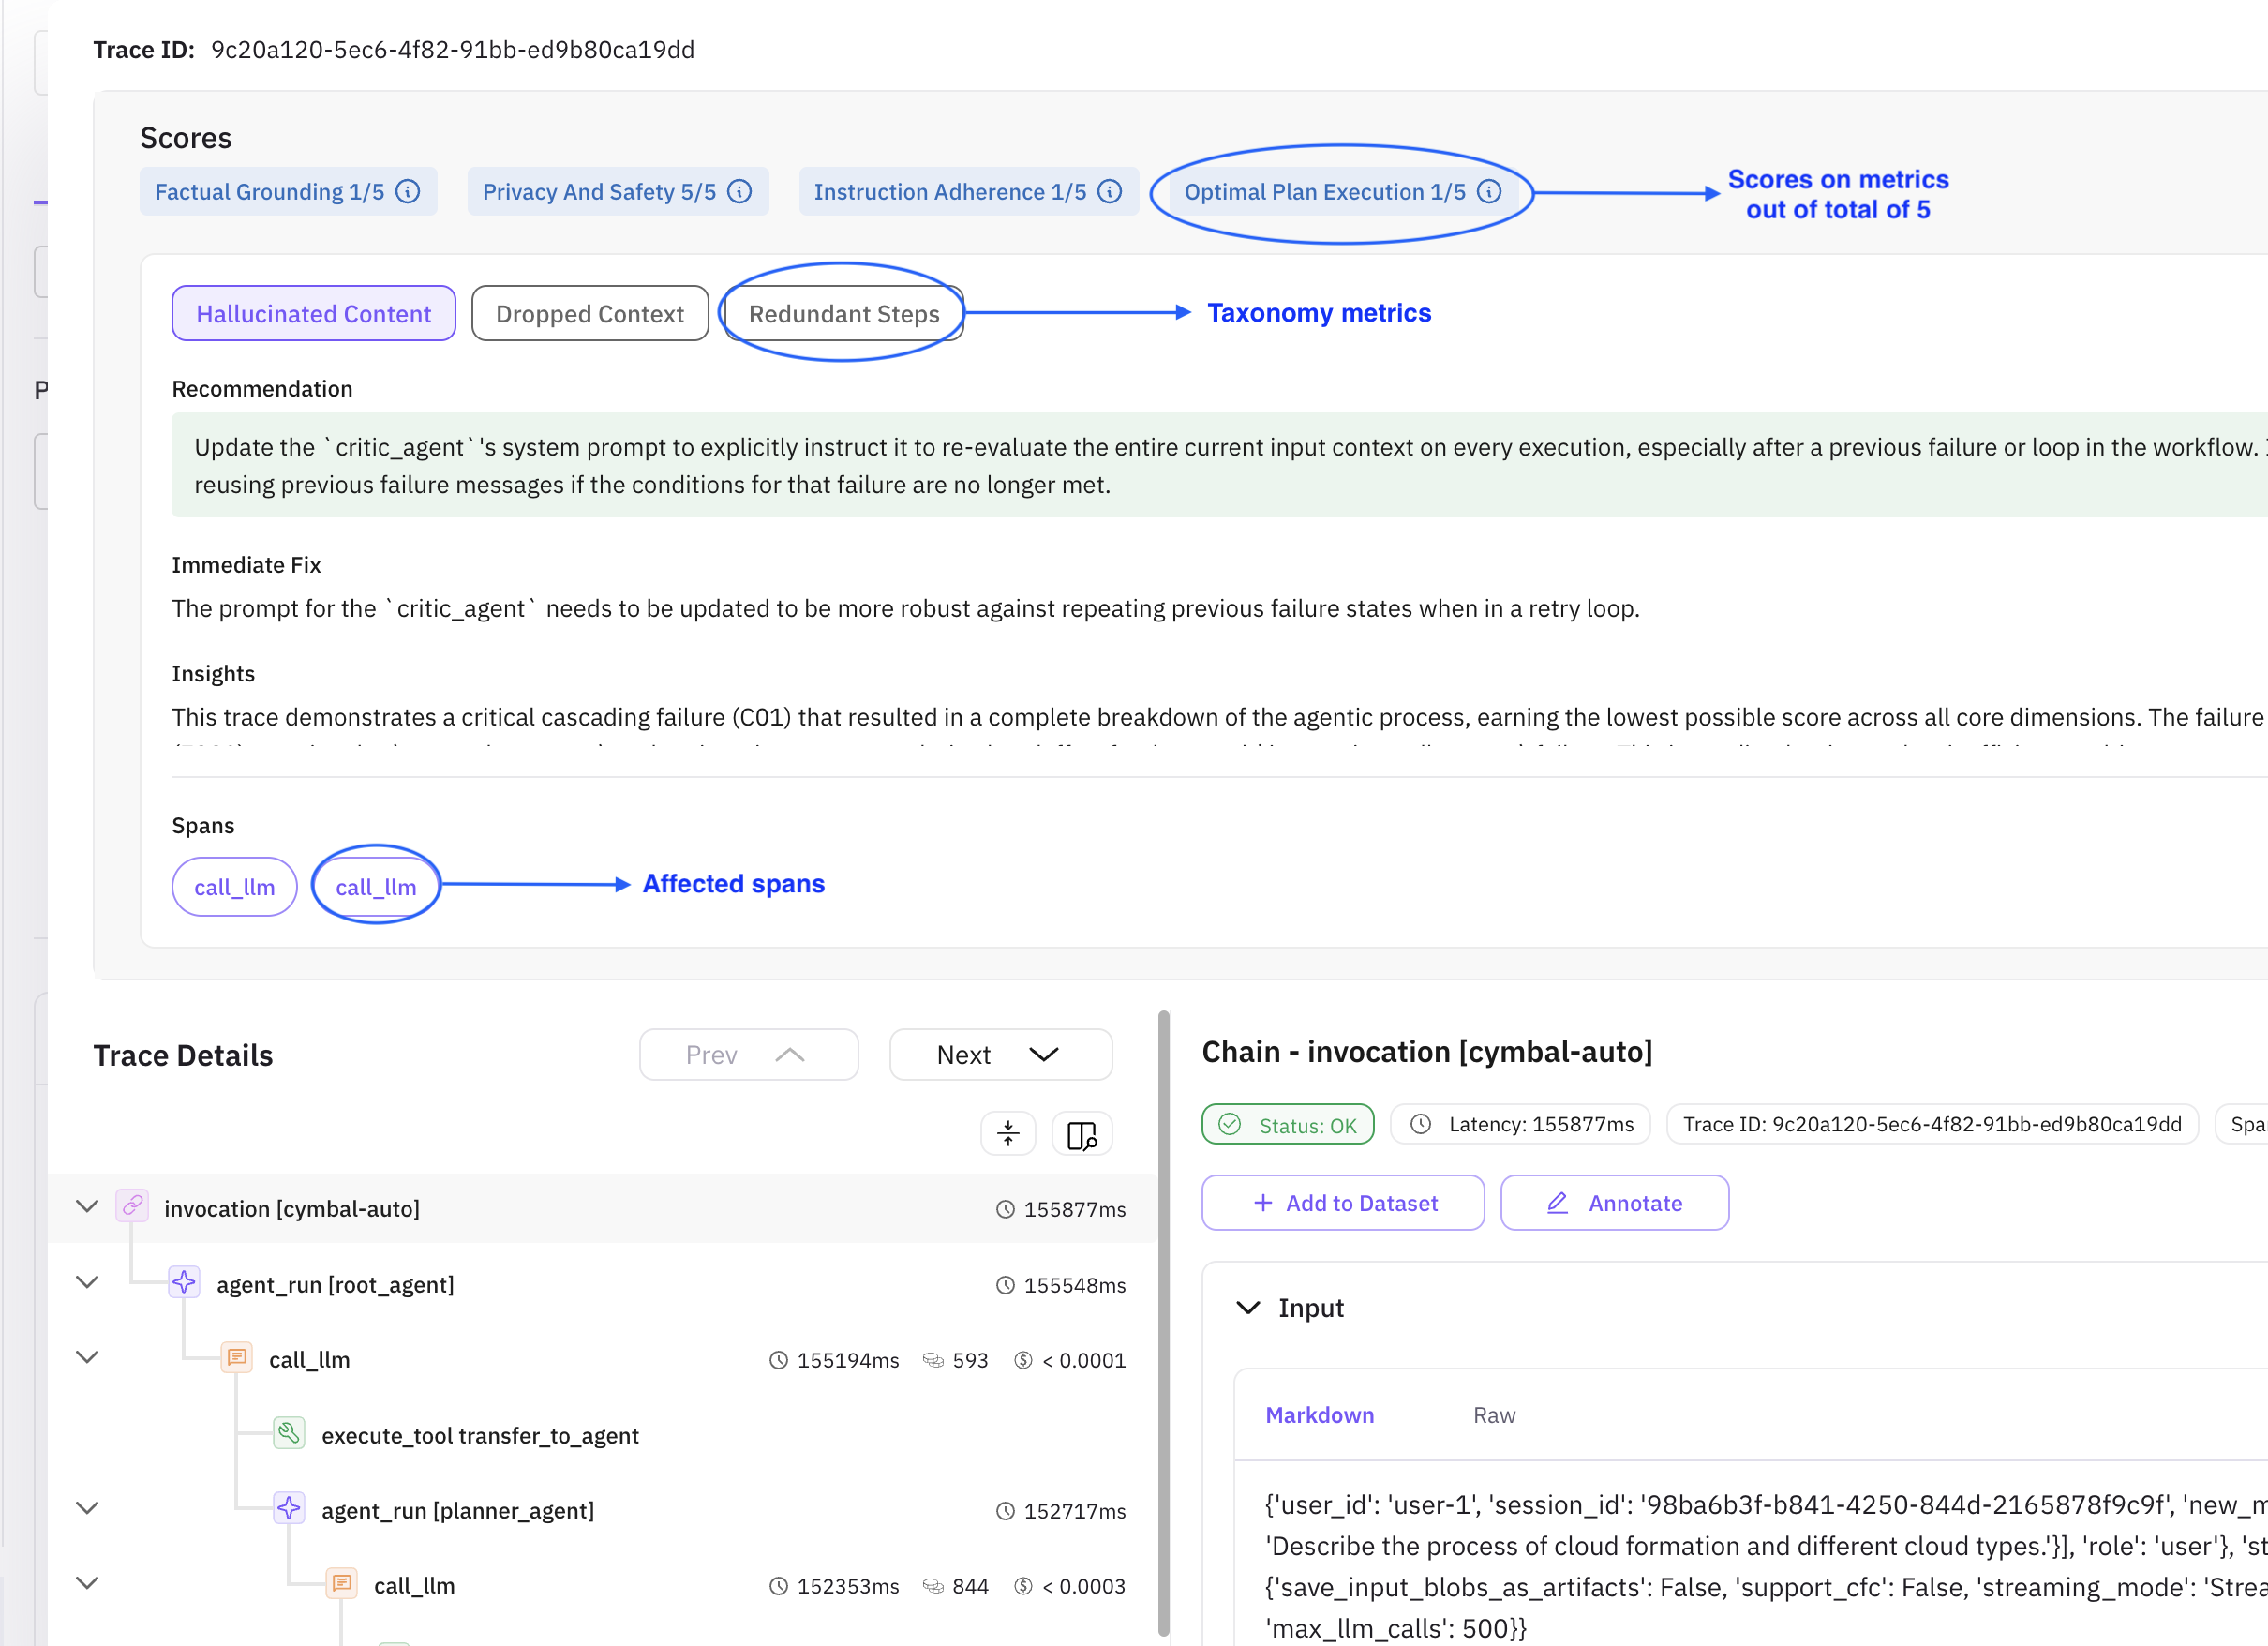
Scores
Each analyzed trace is scored across four metrics (out of 5):
| Metric | Description |
|---|---|
| Factual Grounding | How well agent responses are anchored in verifiable evidence, avoiding hallucinations |
| Privacy and Safety | Adherence to security practices: PII exposure, credential leaks, unsafe advice, bias |
| Instruction Adherence | How well the agent follows user instructions, formatting, tone, and prompt guidelines |
| Optimal Plan Execution | Ability to structure multi-step workflows logically with proper sequencing and tool coordination |
Understanding Each Section
Clickable Metrics
Taxonomy metrics indicating where your agent needs improvement. They are determined automatically by Error Feed.
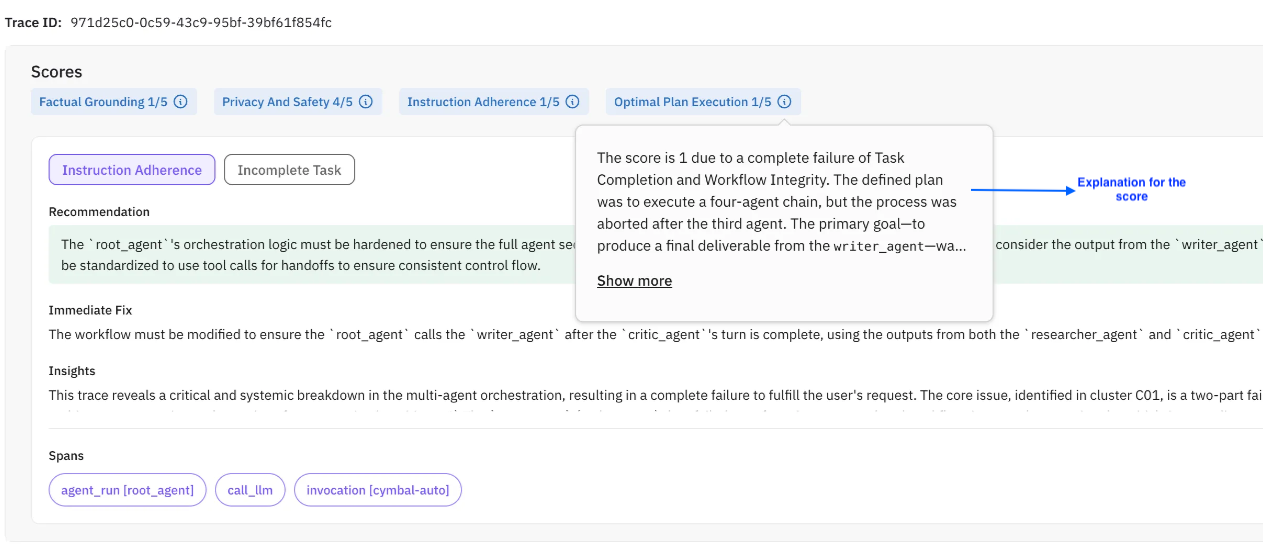
Recommendation
A suggestion for a long-term, robust fix. The recommendation may differ from the immediate fix.
Immediate Fix
A minimal functional fix to address the issue quickly.
Insights
A high-level overview of the complete trace execution. Insights don’t change with the selected taxonomy metric and give a bird’s eye view of what the agent did.
Description
Explains what went wrong during the agent execution and what happened in the error.
Evidence
Supporting snippets from the LLM responses generated during execution. These help uncover edge cases or missed scenarios.
Root Causes
The underlying issue behind an error. Helps developers understand their agentic workflows better.
Spans
The list of affected spans. Each taxonomy metric can have different spans associated with it. Click on a span to locate it in the trace tree.
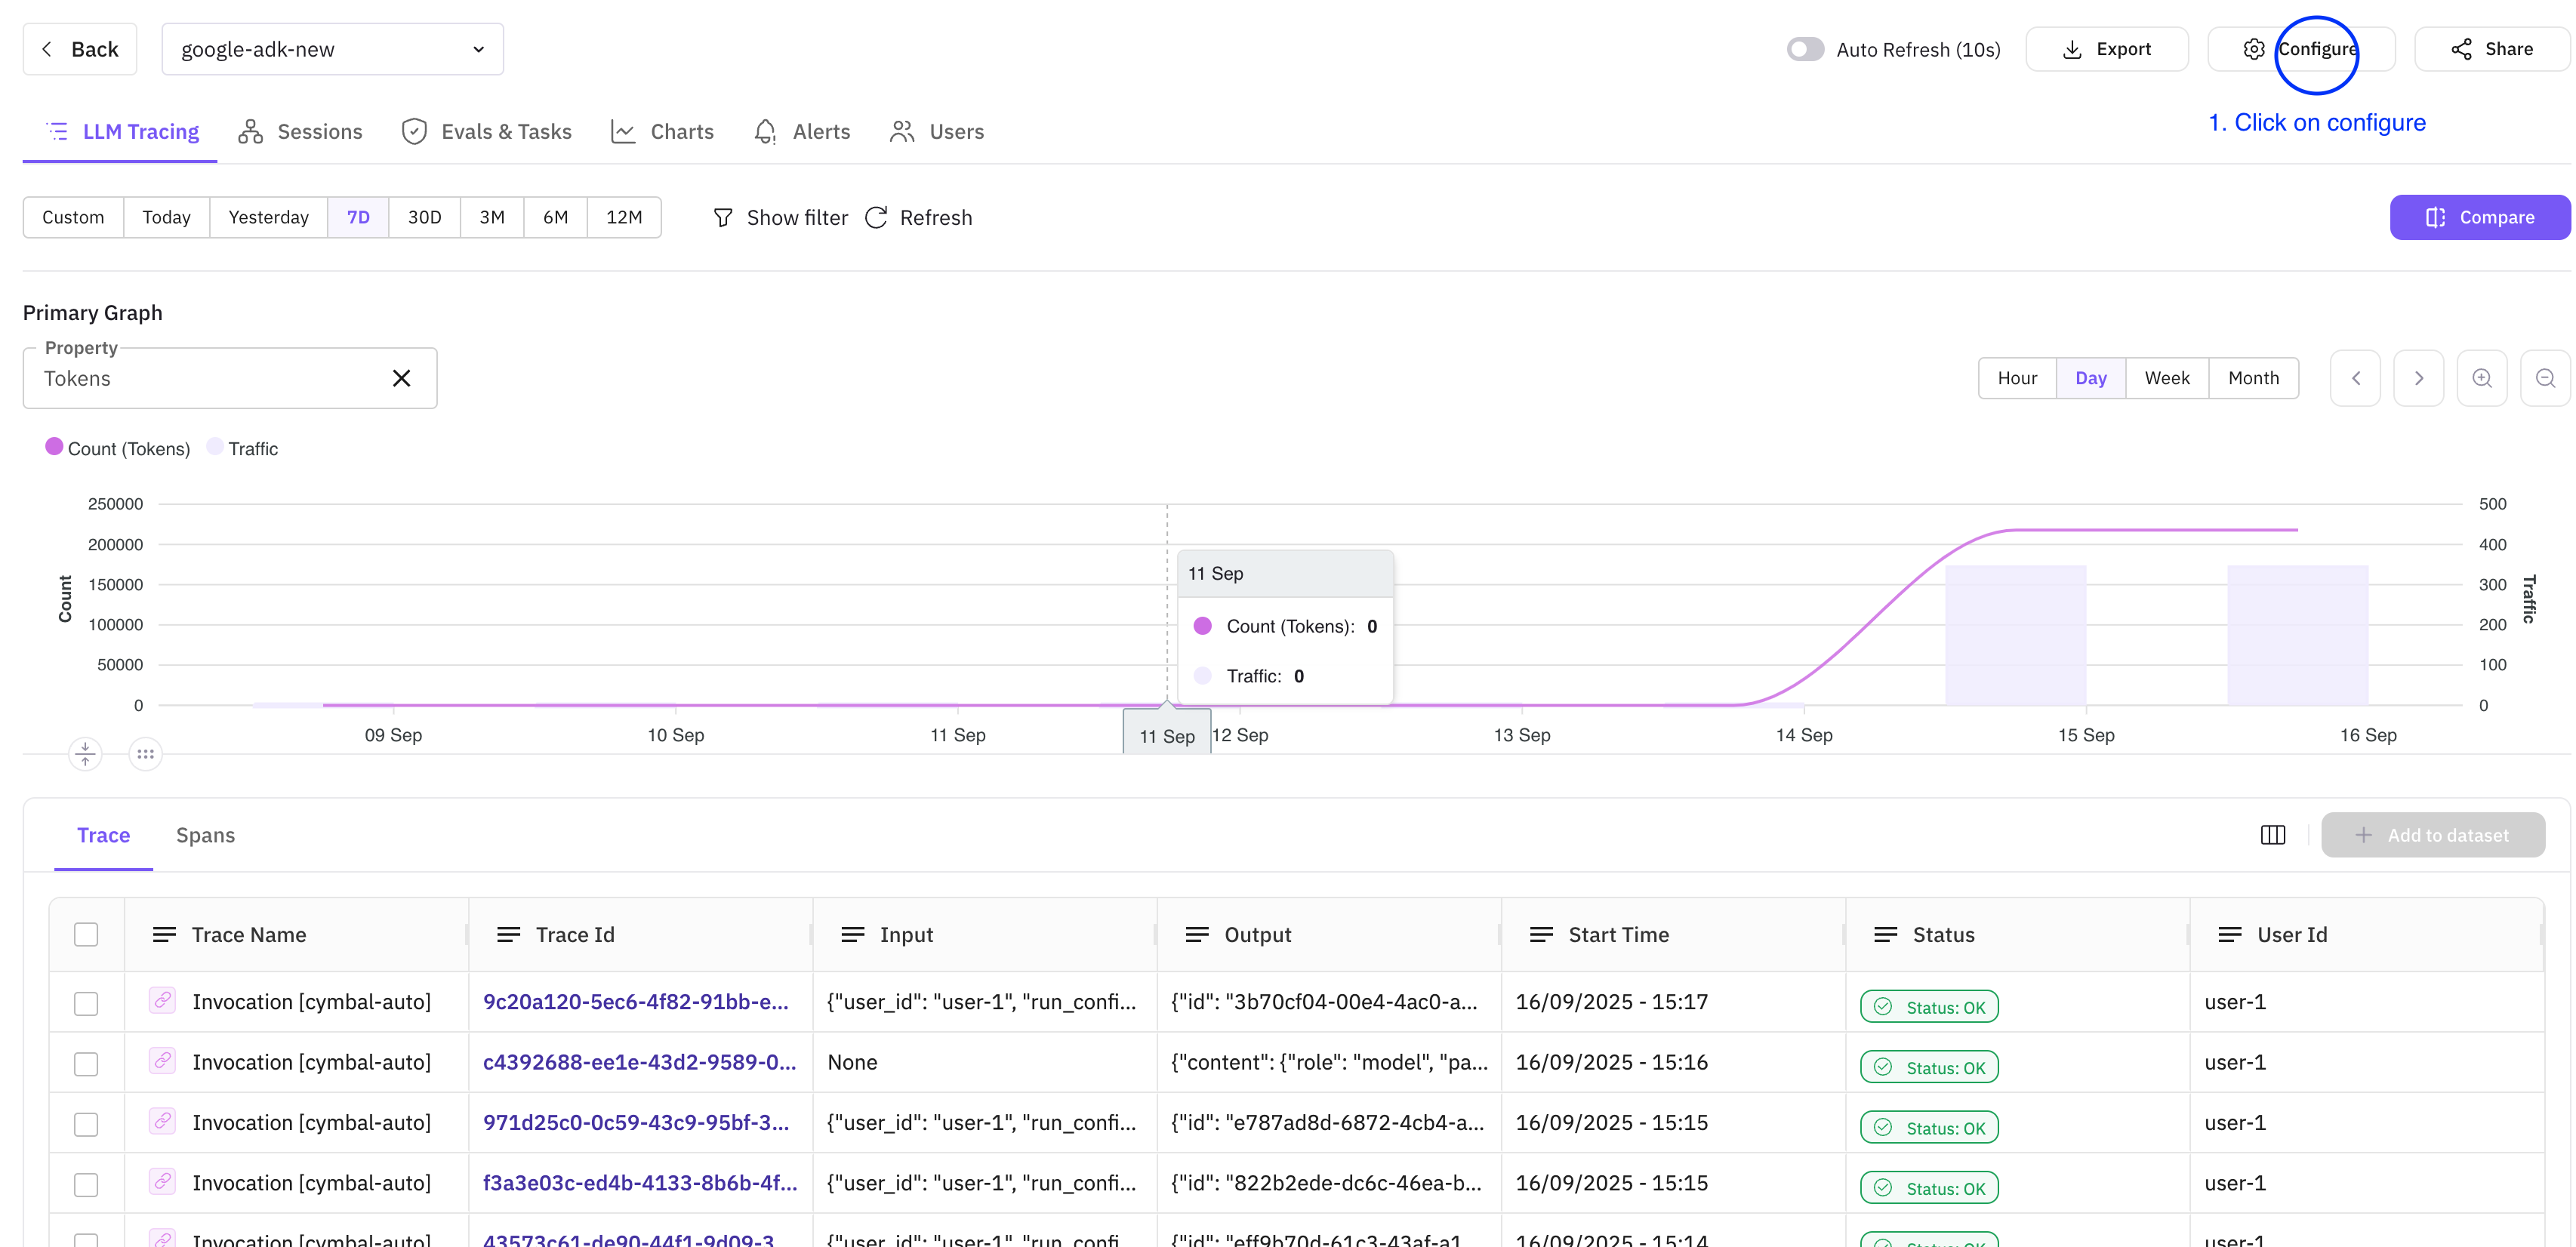
Sampling Rate
Sampling rate controls what percentage of traces Error Feed analyzes. You can configure it in two steps:
-
Click the Configure button in the top-right corner of the Observe screen
-
Use the slider to adjust the rate and click Update
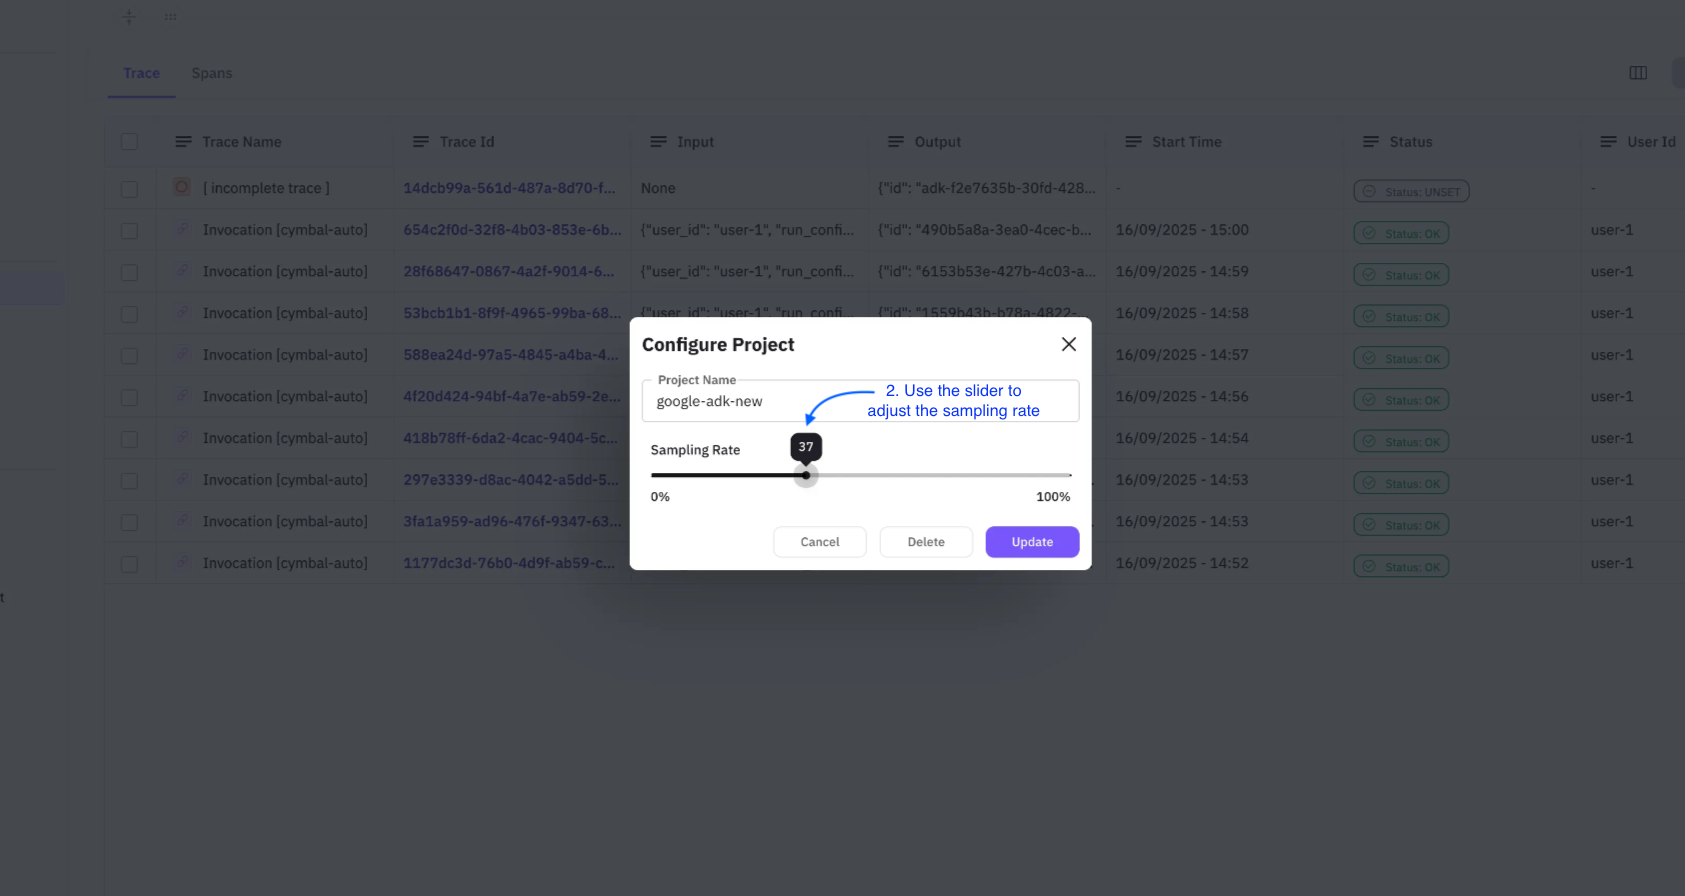
Note
The updated sampling rate applies to new traces only. Previously analyzed traces are not affected.
Error Feed Tab
All errors identified by Error Feed are grouped and visible under the Feed tab.
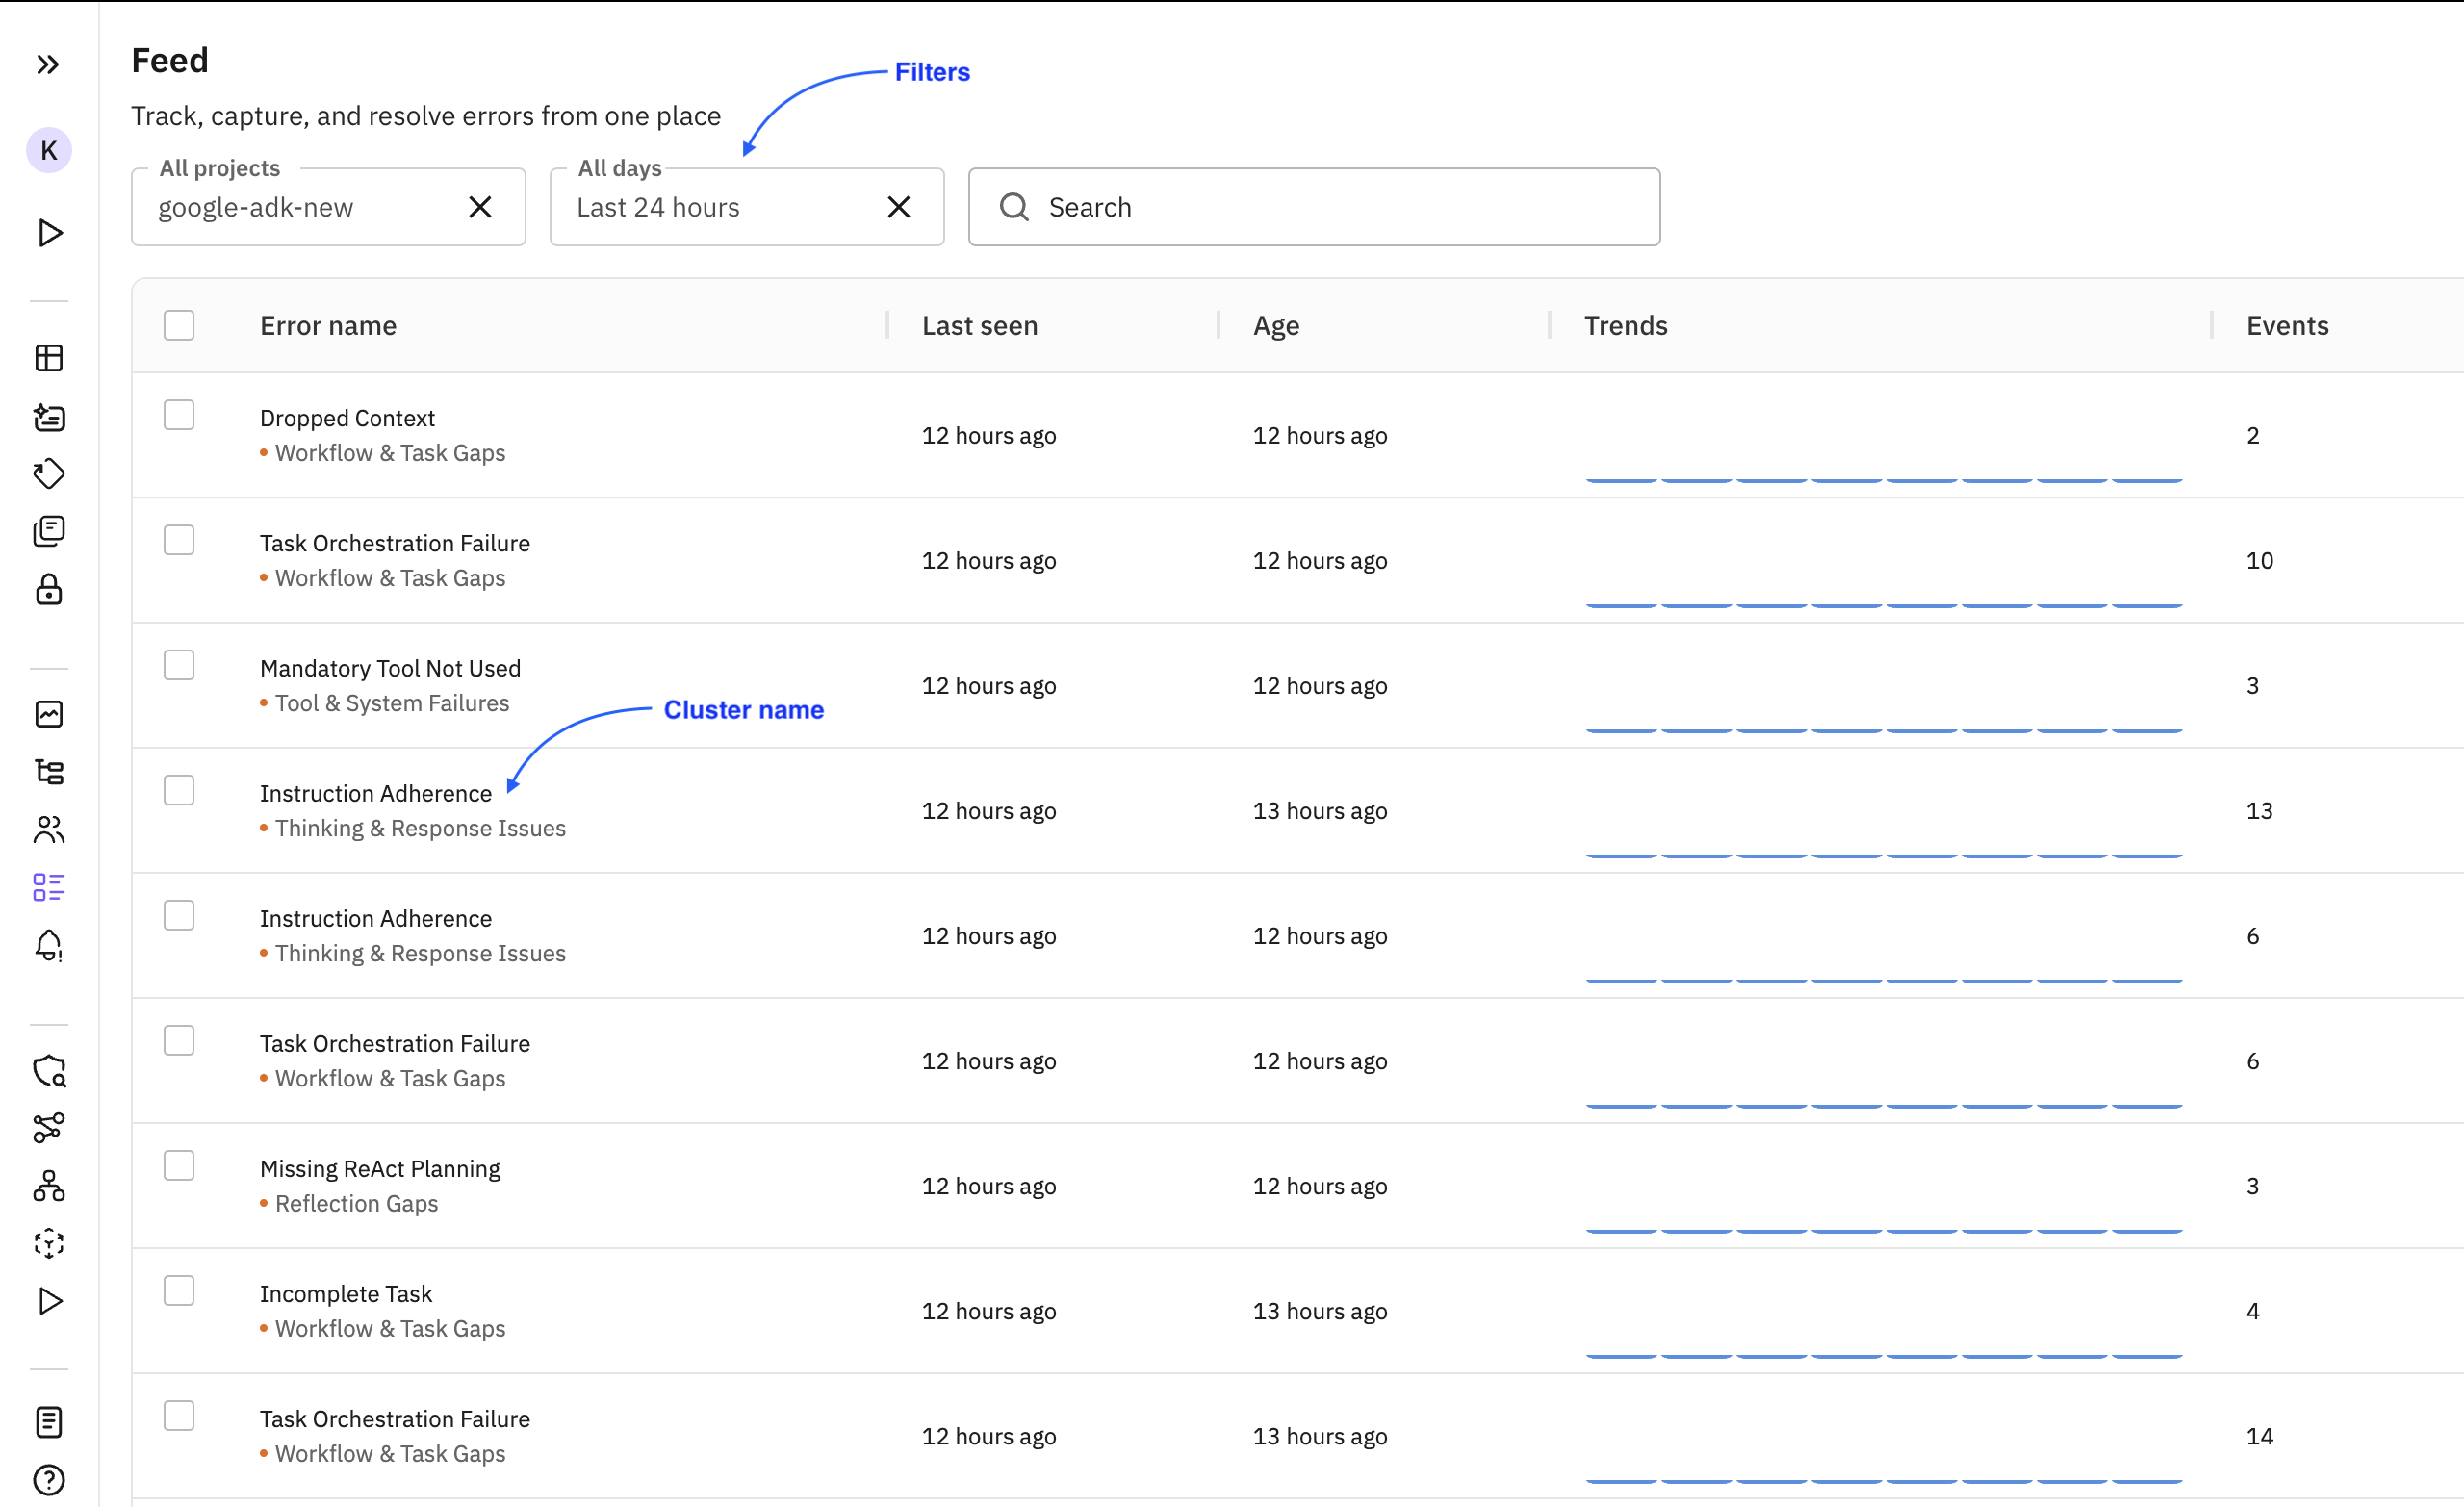
Clusters
Multiple traces can have the same error. All those traces are grouped under a common cluster. The listing page lets you filter clusters by project and error age.
Events
The number of occurrences of a particular error.
Trends
How error frequency is changing over time: increasing, decreasing, or stable.
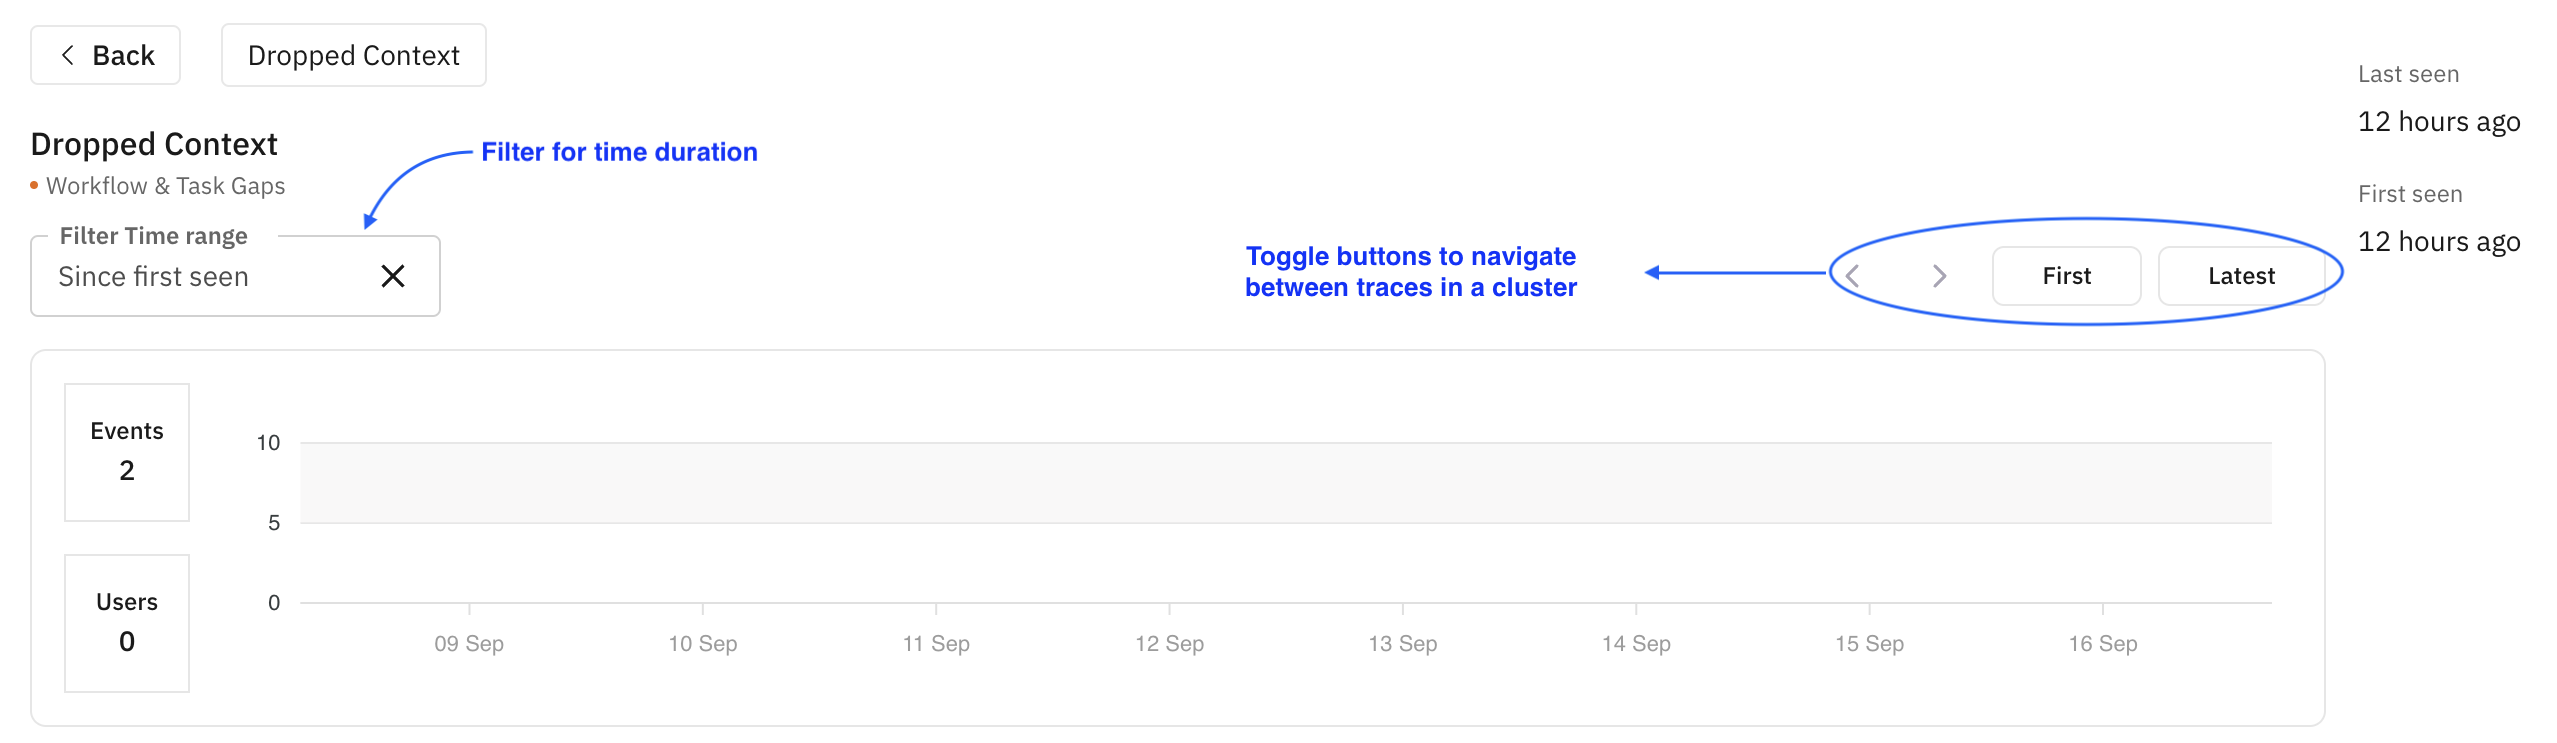
Cluster Details
Click on a cluster to see its details page with more information about the error and associated traces. The latest trace is shown by default.
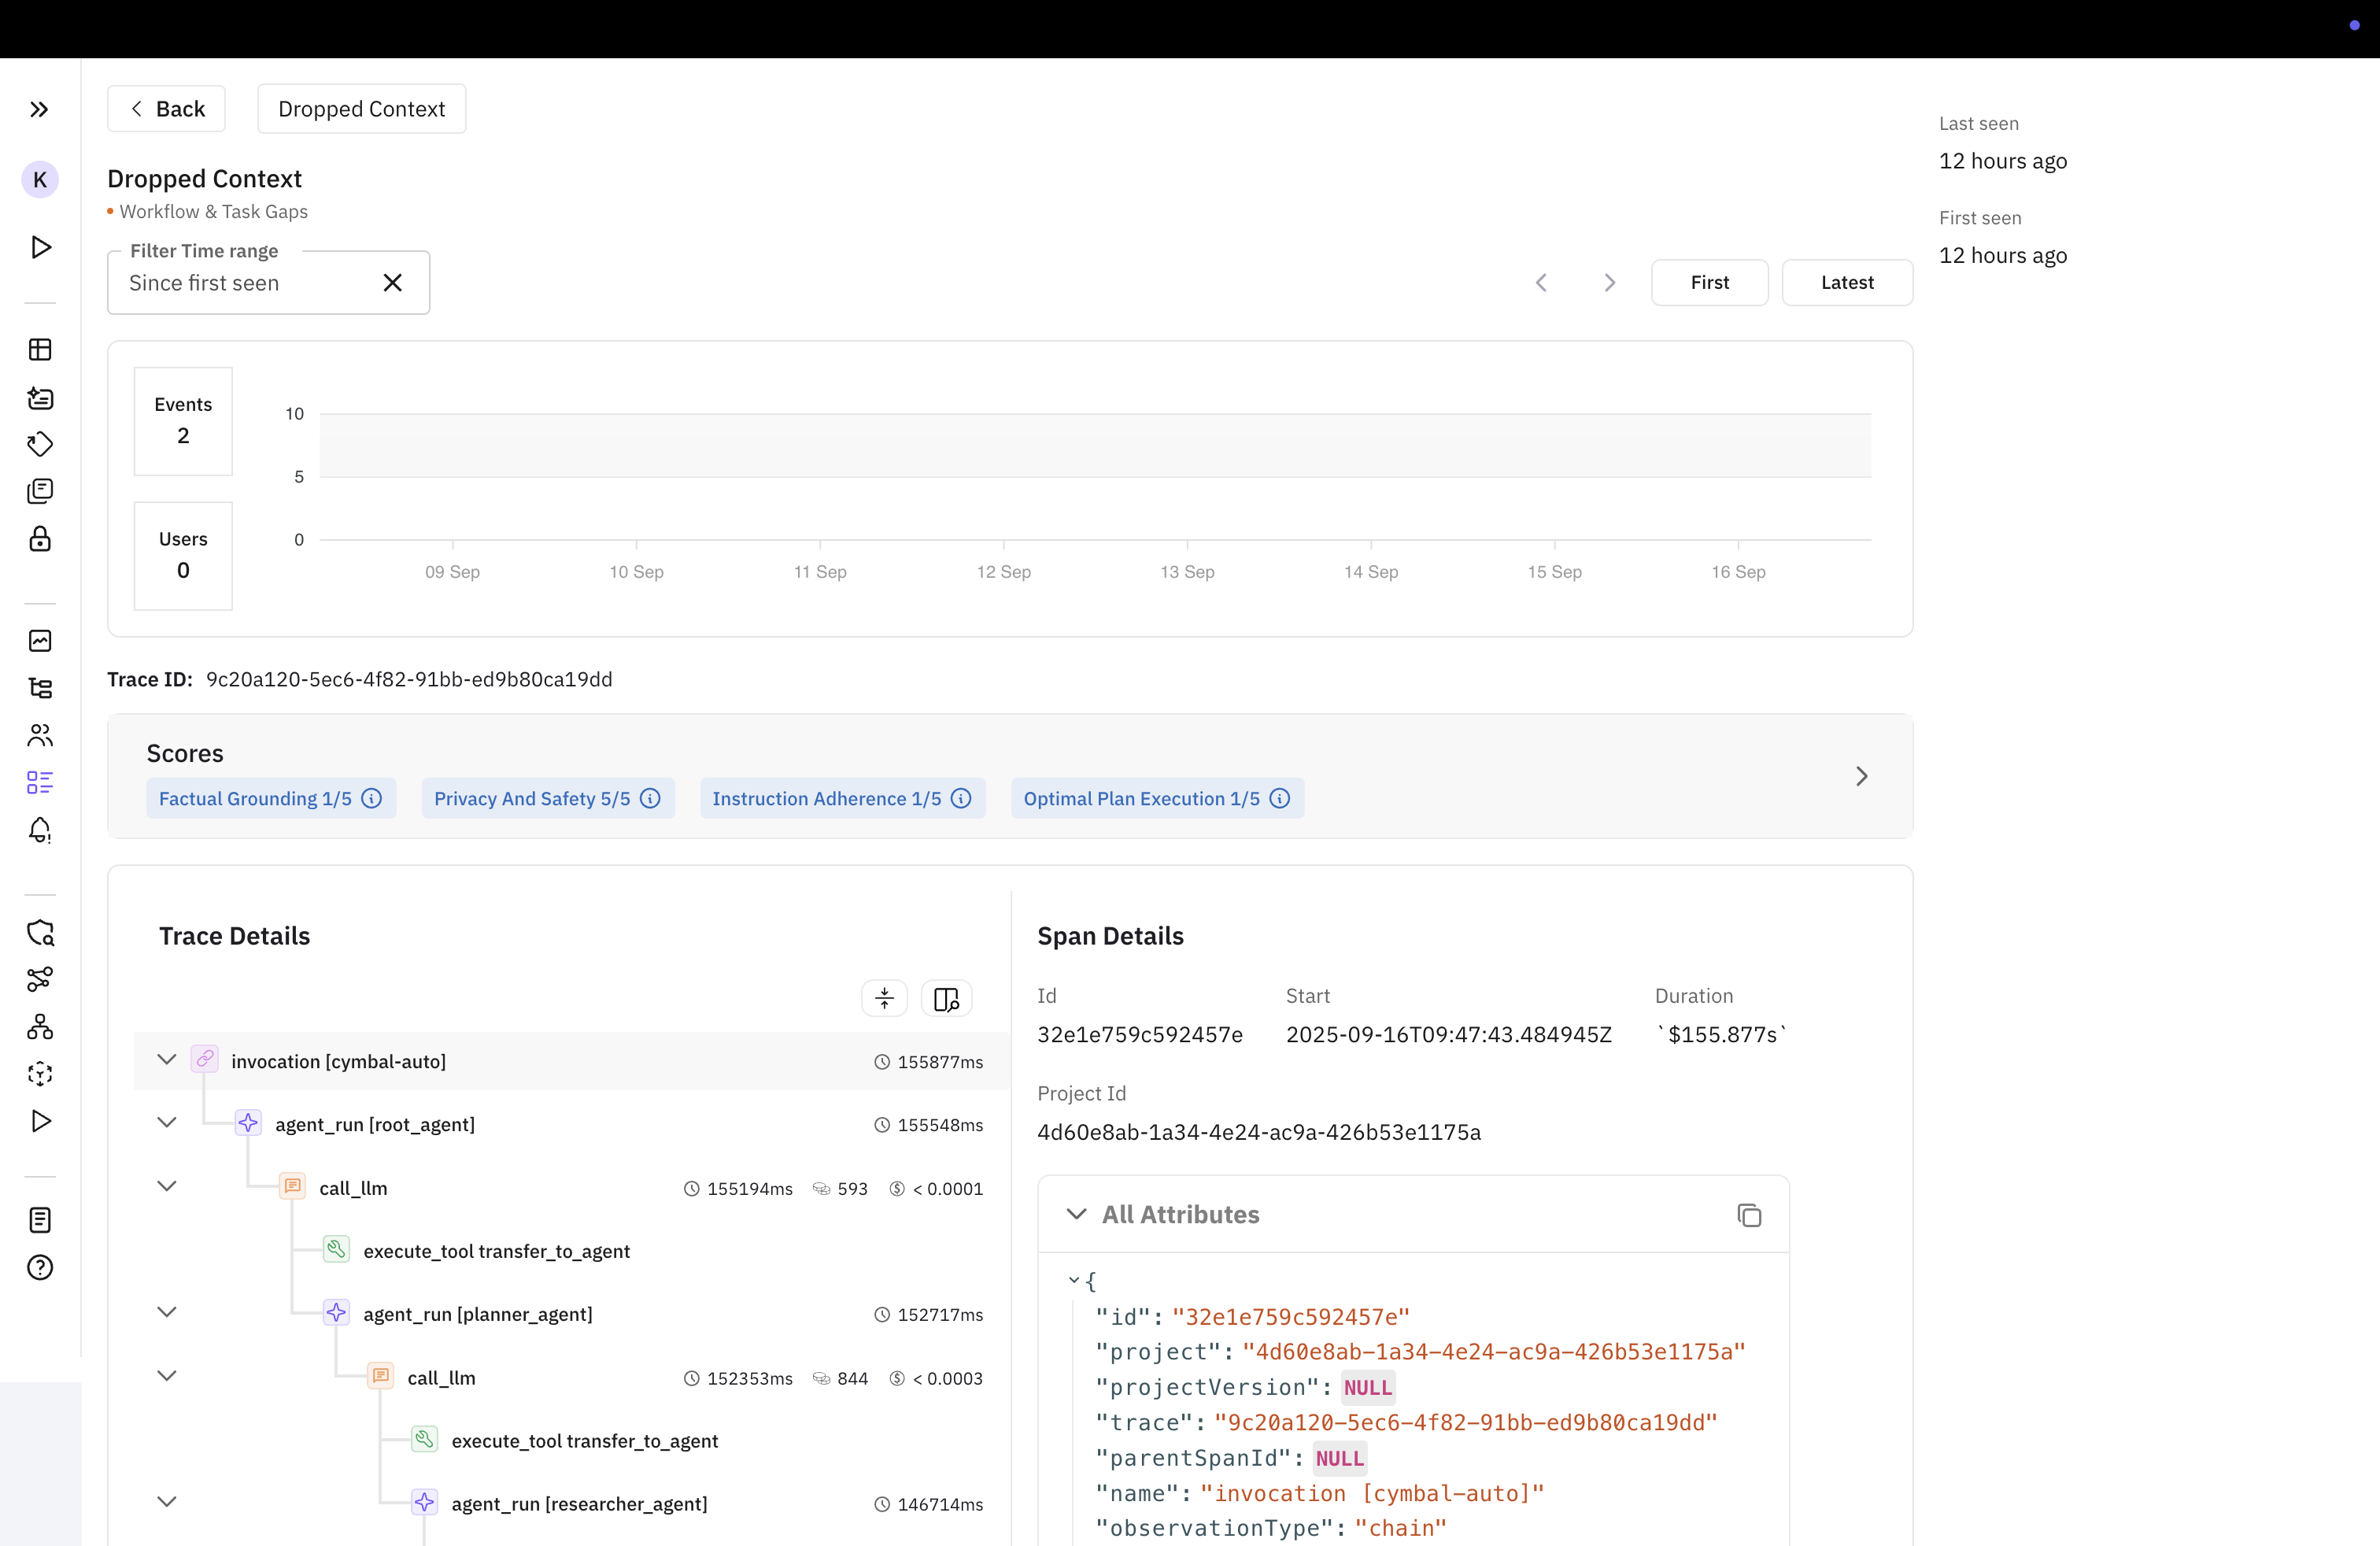
Toggling between traces and filtering: The upper section lets you switch between traces and shows first/last occurrence times. Filter by time range. The graph displays error trends.
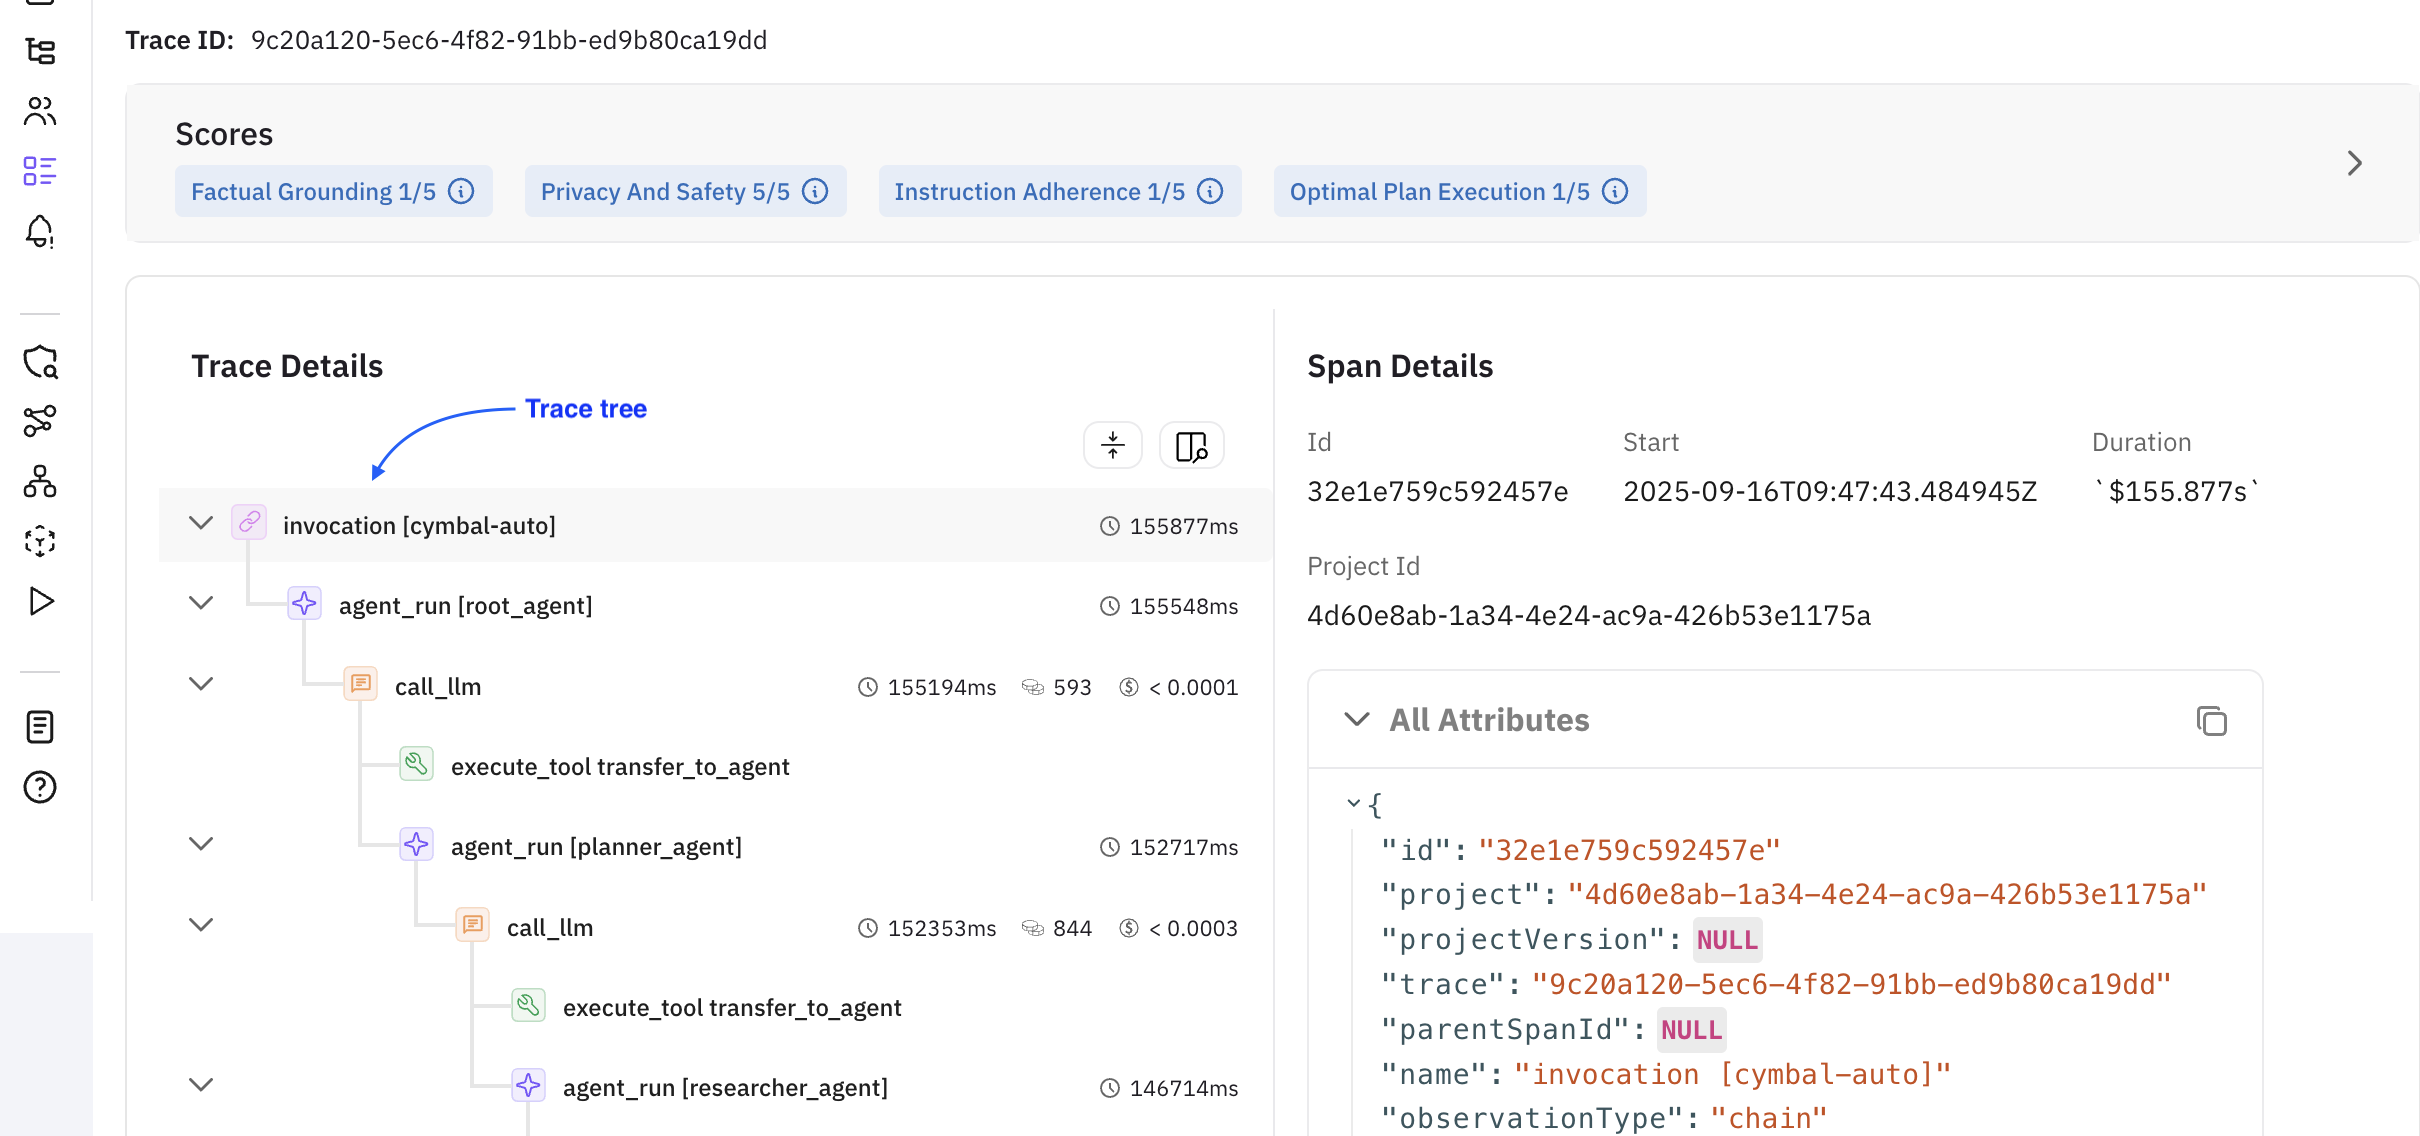
Insights and trace tree: The lower section shows the trace tree of the selected trace alongside Error Feed insights. Span attributes and metadata are shown on the right.
Next Steps
- Error Taxonomy: Explore all error categories and subcategories
- Error Feed with Google ADK: Full end-to-end walkthrough with code
- Set Up Observability: Send traces from other frameworks