No issues in the feed
Five causes for a Feed with zero rows, in the order to check them.
The Feed loads, but the table is empty. Work out which situation you’re in before you touch anything:
- Which empty-state message does the table show? Filters are hiding the rows quotes both in full.
- The filtered message means the data may already be there, just filtered out, so skip straight to that section
- The unfiltered message means no issues have been found. Work through the causes below, in order
- Check the causes in order:
The list starts with the license check because it’s the cheapest to rule out: the answer is visible on the page you’re already looking at. If you’ve worked through all five causes and the Feed is still empty, confirm traces are reaching this project at all: see No traces appearing.
The workspace has no Error Feed license
Without the Error Feed capability, the Feed page can’t show a table at all: it shows an upgrade message instead, and a direct API call for feed data comes back with a 402.
The message reads “This feature requires an upgrade.”, with a reason code and a Contact us to upgrade button. If instead you see “Couldn’t verify feature access.” with a Retry button, that’s a different problem: the check itself failed transiently, not a licensing block, so retry it.
Fix: if you’re looking at “This feature requires an upgrade.”, this is your cause. Use the Contact us to upgrade button.
The sampling rate is still 0
Error Feed ships with a project’s sampling rate at 0, which disables scanning entirely. Nothing gets sampled, so nothing can ever reach the Feed. This is the shipped default, not something anyone had to break, so it’s by far the most common reason the Feed is empty.
Fix: raise the project’s sampling rate above 0. See Turn on Error Feed for where that control lives and how to pick a rate.
The traces are too new
Scanning is triggered per trace, not on a timer, and only once a trace’s root span has completed. Even then, Error Feed waits about ten seconds before sampling and scanning it. A trace that finished moments ago hasn’t necessarily been scanned yet.
Fix: give it roughly ten seconds after the trace completes, then refresh the Feed.
The traces came in through the collector
Traces that arrive through the collector don’t trigger a scan on arrival. They wait for a periodic sweep instead, which adds its own grace period on top of the ten-second wait above. Check with whoever set up tracing for this project to see whether traces route through the collector.
The sweep dispatches a scan task for every 15 pending traces, and each trace holds for a 60-second grace period before it’s eligible. Because collector-routed traces are picked up by that sweep rather than one at a time, they show up in occasional bursts rather than the steady trickle you’d see from a trace that triggers its own scan.
Fix: wait at least 60 seconds after the trace lands before assuming scanning isn’t working, since that’s the grace period each trace holds before it’s even eligible for a sweep, and scanning still waits the same ten seconds after that. Expect issues to land in bursts rather than one at a time.
Filters are hiding the rows
The table’s empty state tells you which situation you’re actually in.
- If your filters exclude everything currently in the Feed, it shows “No errors match your filters” / “Try adjusting your search or filter criteria.”
- If there genuinely are no issues, it shows “No errors — everything looks good!” / “Errors captured by Future AGI will appear here.”
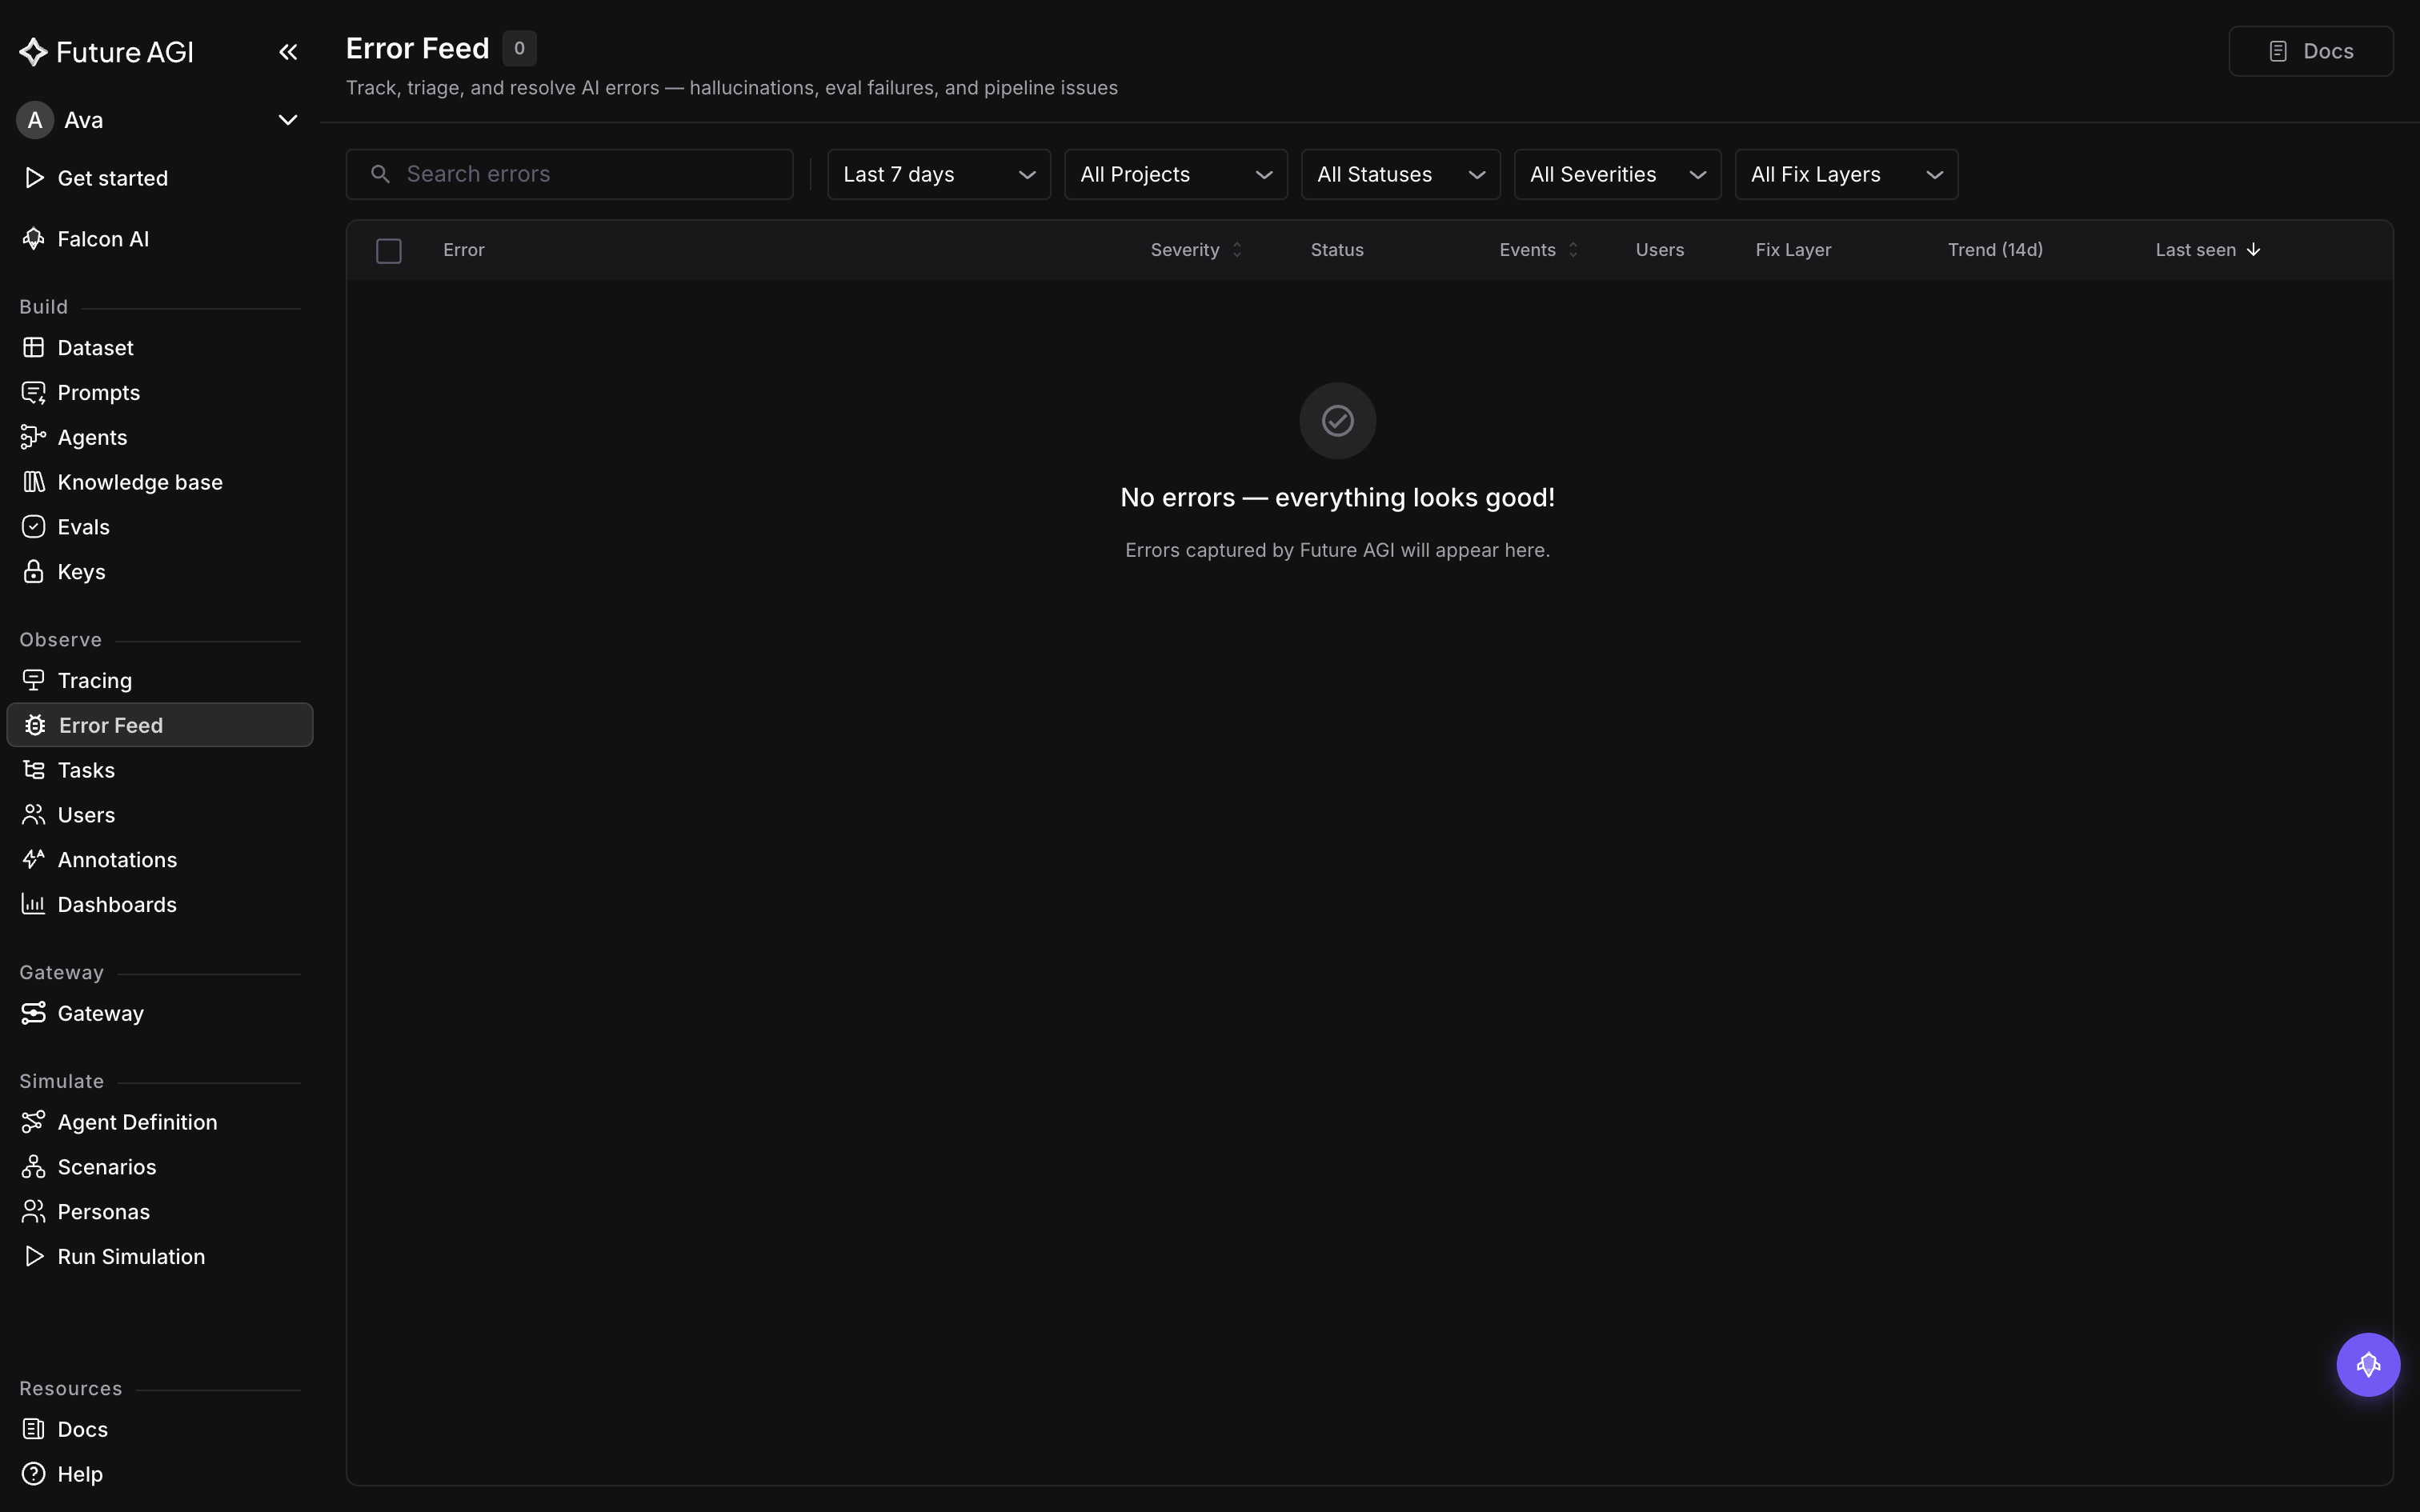
The unfiltered case: every filter still at its default, and the count beside the title reads 0
Fix: if you’re looking at the first message, clear or widen your filters. The Clear control:
- resets project, status, severity, fix layer, and search
- never resets the time range
- only appears once one of project, status, severity, or fix layer is set
So widen a narrow time range yourself. Neither message rules the time range out, since it isn’t part of what the table checks: widen it before you go back through the causes above.
Dive deeper
Questions & Discussion