Annotation Analytics & IAA Metrics
Track queue progress, annotator throughput, label distribution, and inter-annotator agreement using Cohen's and Fleiss' Kappa metrics.
About
Every annotation queue includes a built-in analytics dashboard that shows progress, throughput, and quality metrics. Use it to monitor how your annotation campaign is going and to identify issues before they compound.
Accessing analytics
Open a queue and click the Analytics tab.
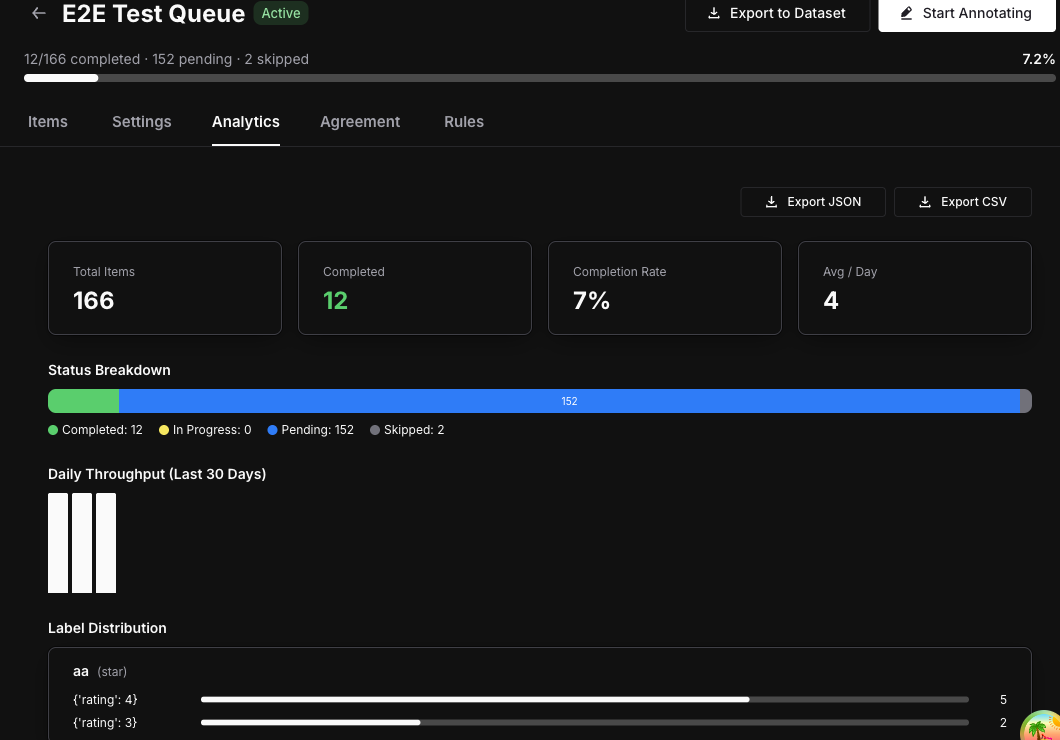
Overview stats
The top of the analytics view shows four key numbers at a glance:
- Total items — Number of items currently in the queue.
- Completed — Number of items that have been fully annotated.
- Completion rate — Percentage of items completed out of the total.
- Average completions per day — Rolling daily throughput across the queue’s lifetime.
Status breakdown
A visual bar displays the distribution of item statuses:
- Completed (green) — All required annotations collected.
- In Progress (blue) — At least one annotation submitted, more required.
- Pending (gray) — No annotations yet.
- Skipped (orange) — Annotator chose to skip the item.
Daily throughput chart
A bar chart showing the number of completions over the last 30 days. Use it to spot trends, identify slowdowns, and measure annotator velocity over time.
Annotator performance table
| Column | Description |
|---|---|
| Annotator | Name and email of the team member |
| Completed | Number of items this annotator has completed |
| Last Active | Timestamp of their most recent annotation |
Label distribution
For each label attached to the queue, the analytics view shows the frequency of each value:
- Categorical — Option counts (e.g., “Positive: 45, Negative: 23, Neutral: 12”).
- Numeric / Star — Distribution histogram across the value range.
- Thumbs — Up vs. down counts.
- Text — Total annotation count (text values are not aggregated).
Inter-Annotator Agreement
Switch to the Agreement tab to see consistency metrics between annotators scoring the same items.
Metrics used:
- Cohen’s Kappa — Used when exactly 2 annotators have scored the same items.
- Fleiss’ Kappa — Used when 3 or more annotators have scored the same items.
The view shows a per-label agreement breakdown so you can pinpoint which labels have the most disagreement.
Interpreting Kappa values:
| Kappa Value | Interpretation |
|---|---|
| < 0.20 | Poor |
| 0.21 — 0.40 | Fair |
| 0.41 — 0.60 | Moderate |
| 0.61 — 0.80 | Substantial |
| 0.81 — 1.00 | Almost perfect |
Note
Agreement metrics require annotations_required to be set to 2 or more in your queue settings, and at least 2 annotators must have scored the same items for results to appear.
Tip
If agreement is low, review your annotation instructions and consider adding clearer guidelines or simplifying label options. Small improvements to instructions often produce large jumps in agreement.
Next steps
Questions & Discussion