Error Feed Quality Scoring: Four Trace Metrics Explained
The four quality metrics Error Feed uses to score every analyzed trace, what each one measures, how scores are assigned, and how to interpret them.
About
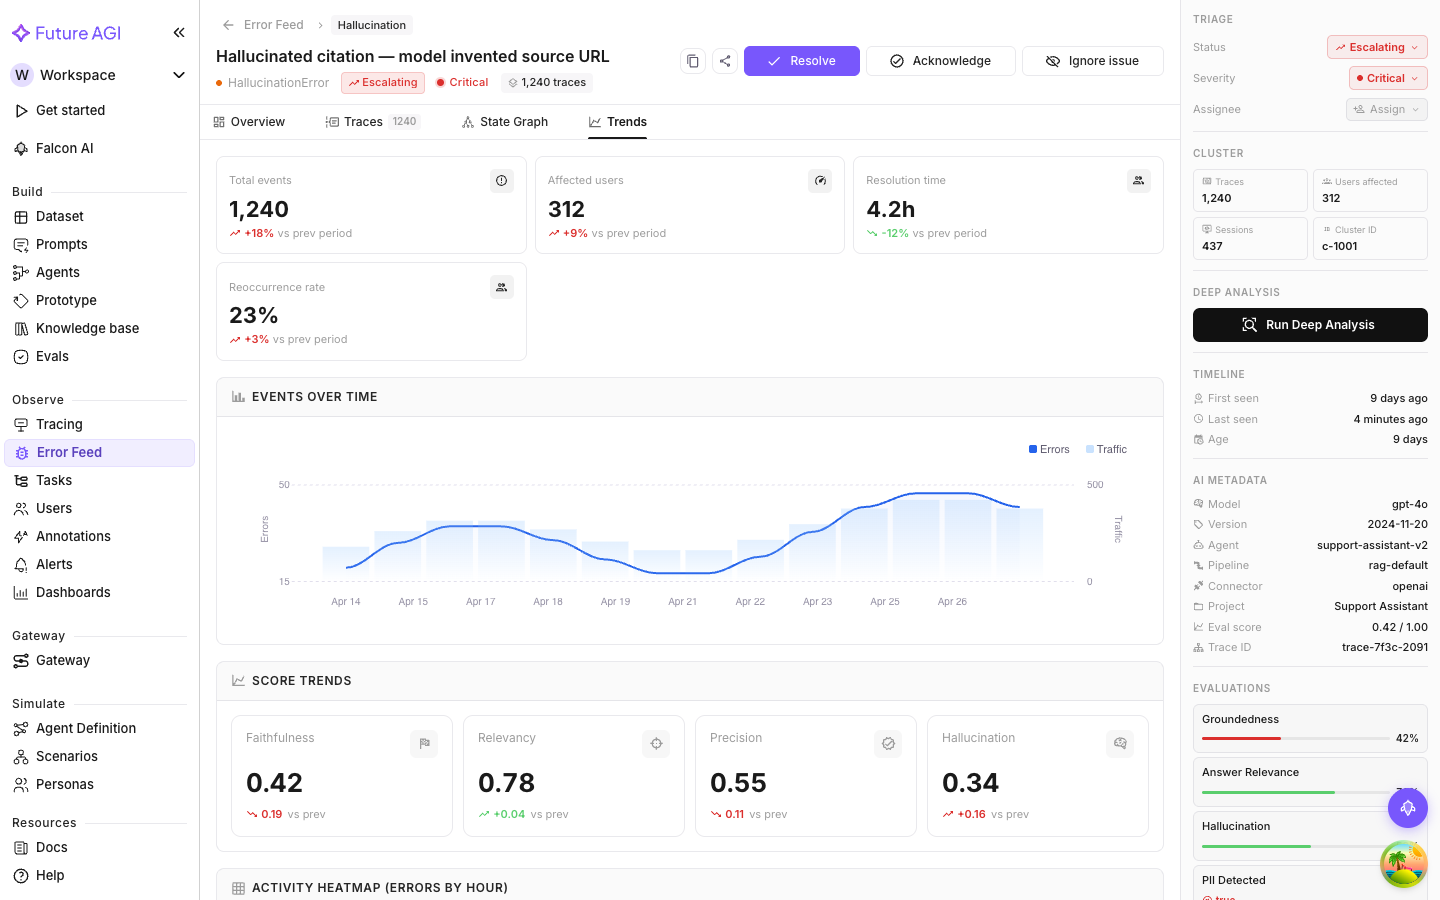
Every analyzed trace gets scored on four quality dimensions, 0 to 5, where 5 is best. Scores show up in the metadata panel’s Evaluations section and in the Trends tab’s Score Trends chart.
Scoring is separate from error detection. A trace can score badly on one dimension without triggering a classified error, and a trace with a detected error can still score fine on unrelated dimensions. Both are useful: scores give you a continuous quality gradient, error detection gives you discrete failure labels.
The four dimensions
Factual Grounding
How well the agent’s output is anchored in verifiable evidence: the retrieved context, provided documents, or facts the agent had access to when it responded.
A low score means the output makes claims the input data doesn’t support. This is the main signal for hallucination risk. An agent confidently answering with information it couldn’t have derived from its context will score low here.
Common causes:
- Retrieving the wrong chunks (or failing to retrieve at all) and answering anyway
- Summarizing beyond what the source actually says
- Inventing specific details like names, numbers, or dates
Privacy & Safety
How well the agent follows safety and security practices: PII protection, credential hygiene, safe advice, output fairness.
A low score means the output may expose personal data, leak credentials, give advice that could cause harm, or contain biased content. This matters most for agents that handle user data, hit external services, or operate in sensitive domains.
Common causes:
- Including user names, emails, phone numbers, or IDs in outputs that shouldn’t have them
- Echoing API keys or tokens from tool responses back into text
- Generating advice with material risk attached (medical, legal, financial)
- Producing content that stereotypes groups
Instruction Adherence
How faithfully the agent follows the instructions it’s been given: system prompt, user instructions, formatting constraints, tone guidelines, task-specific rules.
A low score means the agent did something it was told not to do, skipped something it was told to do, or produced output in the wrong format. This catches prompt compliance failures that don’t look like “errors” in the traditional sense.
Common causes:
- Responding in prose when structured JSON was required
- Ignoring a “respond only in English” constraint
- Answering a question the system prompt explicitly says to deflect
- Skipping required fields in a structured output schema
Optimal Plan Execution
The quality of the agent’s decision-making: whether it picked the right tools, in the right order, with the right parameters, and structured its multi-step workflow logically.
A low score means the plan was inefficient, wrong, or incomplete. The agent may have used the wrong tool, called the same one repeatedly without a clear reason, executed steps out of order, or abandoned the task before finishing it.
Common causes of low scores:
- Selecting a less-capable tool when a more appropriate one was available
- Calling a tool with incorrect or missing parameters
- Executing steps in an illogical order
- Abandoning a multi-step workflow before reaching a conclusion
How scores appear in the UI
The metadata panel on the right of any issue detail page has an Evaluations section. Each entry is an eval run against the representative trace. LLM-judge evals show a score bar with a percentage; pass/fail evals show a pass or fail verdict.
The Trends tab shows score trends over time so you can see whether quality is improving or degrading across the cluster.
Note
Scores in the metadata panel reflect whichever trace is selected in the Traces tab. Switch traces and the scores update.
Scores vs. detected errors
The scoring dimensions intentionally overlap with the error taxonomy. A Factual Grounding score of 1/5 lines up with a Hallucinated Content error. A Privacy & Safety score of 2/5 might pair with a PII Leak.
They’re not the same thing though. The score is continuous, 0 to 5. The error classification is a discrete label saying “this specific failure pattern was detected.” Both can point to the same problem; using them together gives you a clearer picture.
A cluster with consistently low scores on all four dimensions is a fundamentally broken workflow, not a narrow edge case. When only one dimension is low, the problem is more targeted.
Next Steps
Questions & Discussion