Error Feed Traces Tab: Navigating Failure Clusters
How to use the Traces tab on an issue detail page to navigate every trace in a cluster and understand the distribution of failures.
About
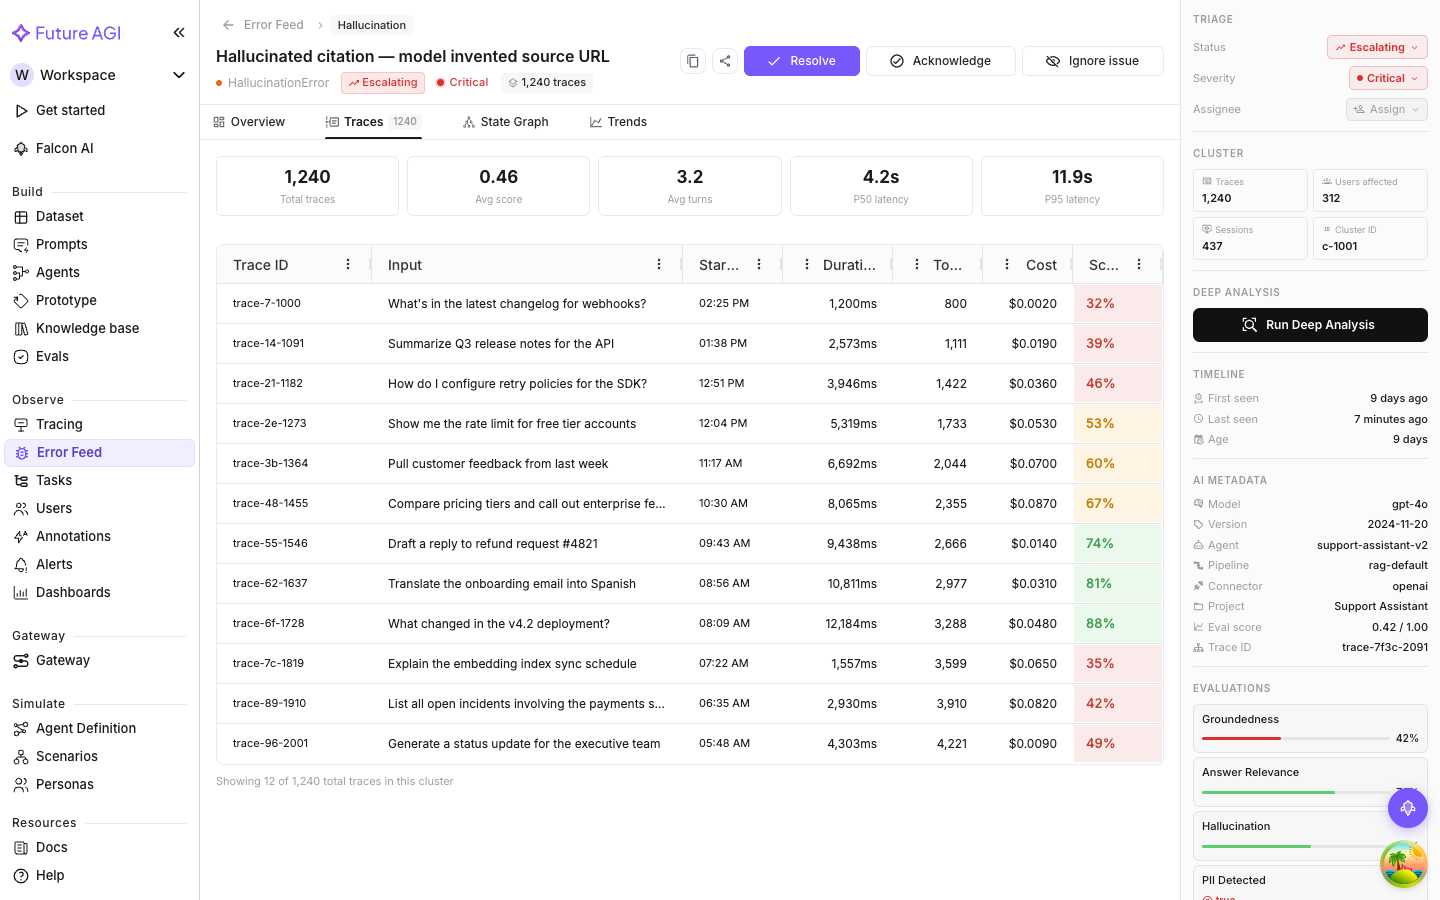
The Traces tab lists every individual trace grouped into the issue’s cluster. The tab label shows the count, e.g. “Traces 47” means 47 traces have been grouped under this issue.
What you see
Each row is one trace from the cluster:
- Trace ID: unique identifier you can use to look it up in Observe
- Status: whether this trace was a failure or (where applicable) a comparison success trace
- Timestamp: when the trace happened
- Latency, tokens, and cost metadata: where available on the original trace
The tab header shows the total count so you can size up the cluster without scrolling.
Navigating between traces
Clicking a trace selects it as the active trace for the detail view. Two effects:
- The metadata panel on the right updates to show AI Metadata and Evaluations for the selected trace instead of the representative trace.
- The Deep Analysis button in the metadata panel will run against the selected trace if triggered.
Useful for investigating specific traces within a cluster: comparing a trace from three days ago against a recent one, or pulling up a trace from a particular user or session.
Tip
The Overview tab always shows analysis for the cluster’s representative trace, not whichever one you’ve selected in the Traces tab. Check the metadata panel’s AI Metadata section to confirm which trace is being analyzed.
Using the Traces tab to understand scope
The trace count on the tab label is the most direct signal of how widespread the problem is. One trace might be a one-off; 500 traces is hitting a large fraction of your traffic (relative to sampling rate).
For high-count clusters, check whether the traces are clustered in time (a systemic issue that appeared on a specific day) or spread evenly over weeks (a recurring edge case, not a single event).
The Trends tab gives you the time-series view, which is the better tool for that kind of temporal analysis.
Relationship to the Observe trace view
The Traces tab is specific to Error Feed and only shows traces belonging to this cluster. It doesn’t replace the Observe trace view: no complete span tree, no annotation editing.
For span-level inspection of a specific trace, copy the Trace ID and look it up directly in Observe.
Next Steps
Questions & Discussion