Error Feed Metadata Panel: Triage, Stats, and Integrations
The right-side metadata panel on an Error Feed issue page covers triage controls, cluster stats, timeline, evaluations, and co-occurring issues.
About
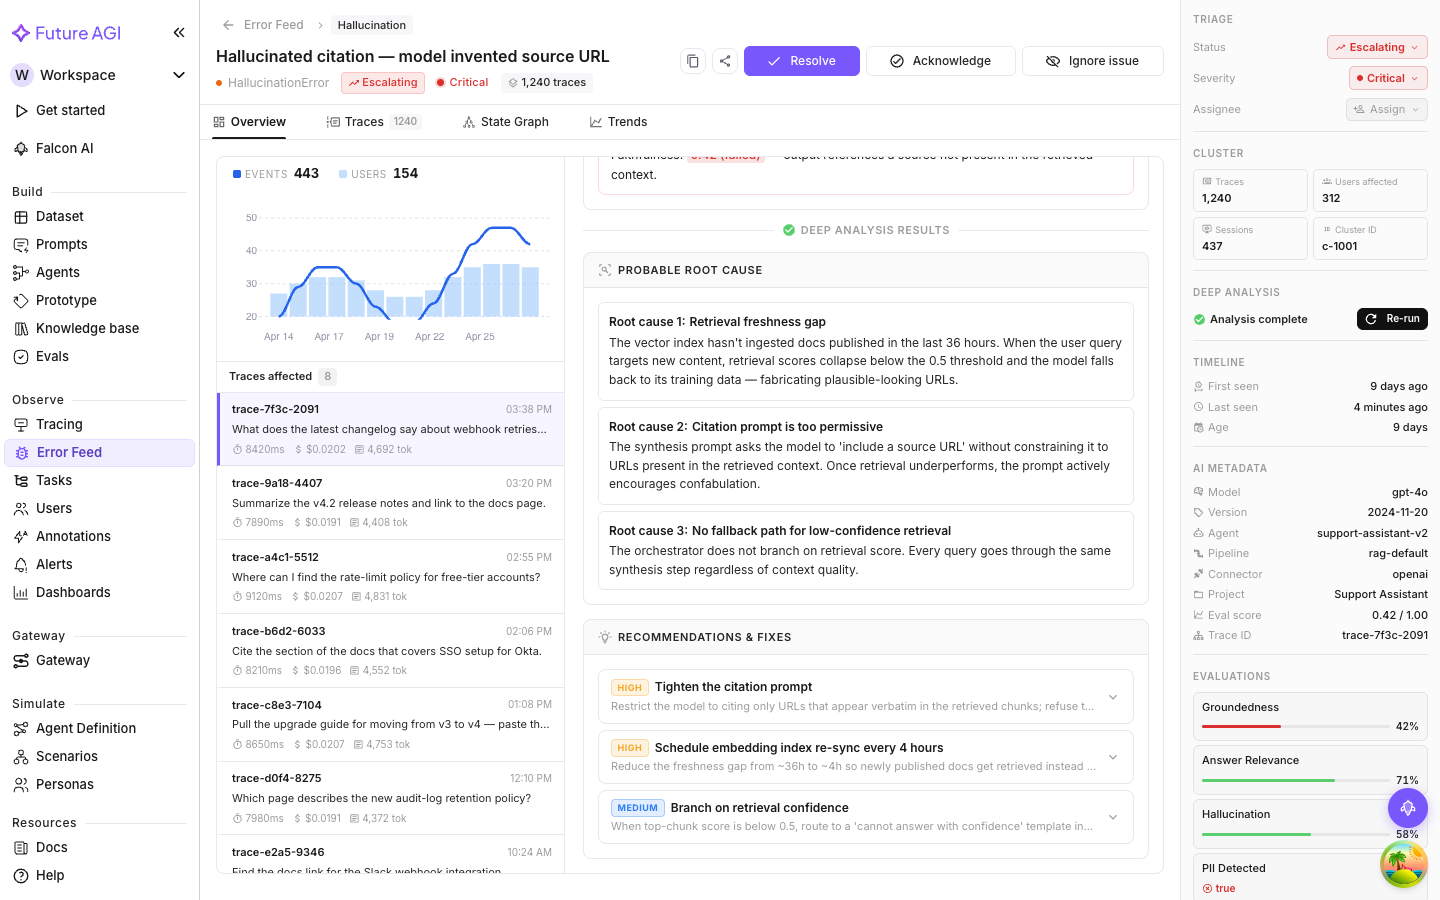
The metadata panel runs along the right side of every issue detail page and stays visible regardless of tab. It’s where the operational info about an issue lives: status, assignee, cluster stats, timeline, AI metadata, evaluations, linked issues, and integrations.
Triage
The Triage section handles status, severity, and assignee.
Status: click the status chip for a dropdown with all states: Escalating, Acknowledged, For Review, Resolved. The chip is color-coded by status. See Severity and Status.
Severity: click the severity chip to change it. Options: Critical, High, Medium, Low. Override the auto-assigned severity whenever you have better context about actual user impact.
Assignee: click Assign to assign the issue to a team member. The dropdown lists everyone in your org. Click the assigned name to reassign or unassign.
Changes take effect immediately and show up in the Feed list view.
Cluster
At-a-glance stats about the issue’s scope:
| Field | What it shows |
|---|---|
| Traces | Total number of traces grouped in this cluster |
| Users affected | Distinct users whose traces appear in the cluster |
| Sessions | Number of distinct sessions represented |
| Cluster ID | The unique identifier for this cluster, used for API access and references |
These give you a fast read on scope without counting rows in the Traces tab.
Deep Analysis
A single button that triggers on-demand investigation of the issue’s representative trace.
- Idle: a “Run Deep Analysis” button. Click to dispatch.
- Running: a progress indicator with “Running analysis…”. Takes about a minute. You can navigate away; analysis continues in the background.
- Complete: “Analysis complete” with a Re-run option. Results populate the Overview tab’s Probable Root Cause and Recommendations & Fixes.
- Failed: “Retry Deep Analysis” if the last run failed.
See Deep Analysis for when to use it and what to expect.
Timeline
When the issue first appeared and when it was most recently seen.
| Field | What it shows |
|---|---|
| First seen | When Error Feed first detected this error pattern, relative to now |
| Last seen | The most recent occurrence in the cluster |
| Age | Days since first detection |
A long age (e.g. 45 days) with a recent “last seen” means the issue has been around for a while without being resolved. Useful context for prioritization.
AI Metadata
Trace-level context about the trace currently being viewed (the representative trace, unless you’ve picked a different one in the Traces tab).
| Field | What it shows |
|---|---|
| Model | The LLM model used in the trace |
| Version | The model version |
| Agent | The agent name, if set in trace attributes |
| Pipeline | The pipeline name, if set |
| Connector | The integration connector used |
| Project | The Observe project this trace belongs to |
| Eval score | The composite evaluation score for this trace |
| Trace ID | The trace’s unique identifier |
Fields not set on the trace are omitted. AI Metadata is useful for correlating issues to specific model versions, e.g. confirming a degradation started when you switched model versions.
Note
AI Metadata reflects the selected trace. Click a different trace in the Traces tab to see its metadata here.
Evaluations
Quality scores for the currently selected trace. Each evaluation is a named row with either:
- A score bar and percentage for LLM-judge evaluations (e.g. Factual Grounding: 62%)
- A pass/fail verdict with a green check or red X for pass/fail evaluations
These correspond to the four dimensions in Scoring, plus any custom evaluations set up on the project.
If every trace in a cluster shows Factual Grounding in the 20–40% range, something is systematically wrong with grounding even if the classifier didn’t flag a specific hallucination.
Co-occurring Issues
When multiple distinct clusters tend to appear together in the same traces, they show up here. Each entry has:
- The co-occurring issue title
- How many traces are shared between the two issues
- Co-occurrence percentage (what fraction of this issue’s traces also appear in that cluster)
High co-occurrence (70%+) usually means a shared root cause: fixing one often fixes the other, or at minimum they’re worth investigating together.
Click any co-occurring issue to jump to its detail page.
Activity
A timeline of significant events for this issue, starting with first detection. Status changes, assignment events, and comments will also land here as the issue moves through triage.
Integrations
Connected issue-tracking tools. Currently Linear is supported.
- Linear not connected: shows a “Connect” button that takes you to Settings → Integrations.
- Connected with no ticket: shows a “Create issue” button.
- Ticket already exists: shows the ticket ID with an option to open it.
See Linear Integration for setup and workflow details.
Next Steps
Questions & Discussion