Error Feed Issue Overview: Header to Recommendations
A walkthrough of the Overview tab on an issue detail page: every section explained, from the header to the AI-generated recommendations.
About
The issue detail page is where you understand a problem well enough to fix it. It opens when you click any issue in the Feed list. Three zones: a header, a tab area, and a metadata panel on the right.
This page covers the Overview tab, which is the default view. For the others see Traces, State Graph, and Trends. For the right sidebar see Metadata Panel.
The header
The header stays visible regardless of which tab you’re on.
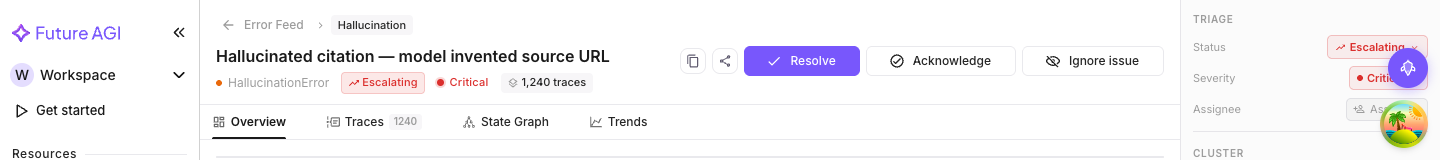
Breadcrumb: “Error Feed” links back to the list. The chip next to it shows the error type (e.g. “Hallucination”, “Tool Failure”).
Error title: the cluster name, describing what’s going wrong.
Status chips row (left to right): error type dot, status chip, severity badge, trace count chip.
Action buttons (top right):
- Copy cluster ID: copies the cluster identifier, handy for tickets or Slack
- Share: copies a direct link to this issue
- Resolve: marks the issue resolved in one click
- Acknowledge: marks the issue acknowledged
- Ignore issue: suppresses the issue from the default view
Note
The Resolve and Acknowledge buttons in the header are shortcuts. The full triage workflow (assigning to a team member, changing severity) lives in the metadata panel. See Triage Workflow.
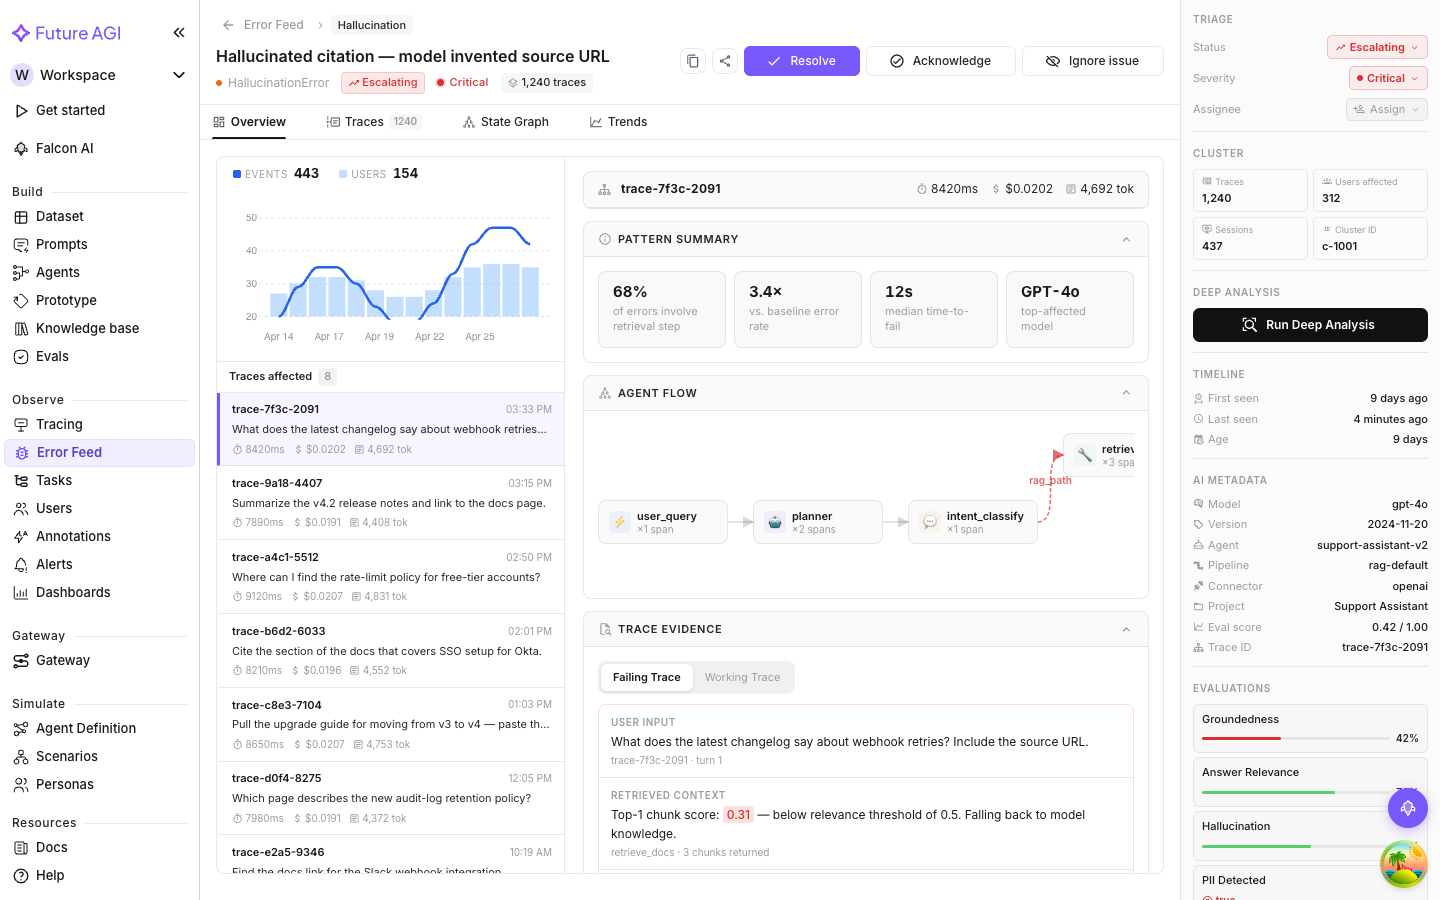
Overview tab layout
Two columns. The left lists every trace in the cluster (the Traces affected panel) along with a small events-and-users chart. The right shows analysis for the selected trace.
Click any trace on the left to focus the right column on it.
Always-visible sections
These sections come from the continuous scan that runs on every sampled trace. They show up the moment you open the issue, no extra action required.
Selected trace header
A compact bar at the top of the right column with the selected trace’s ID, latency, cost, and total tokens. Treat it as the breadcrumb for which trace’s analysis you’re currently looking at.
Pattern Summary
A summary of patterns across the whole cluster, not just the selected trace. The card has a one-line takeaway plus four headline metrics (e.g. “68% of errors involve retrieval step”, “3.4× vs. baseline error rate”, ”12s median time-to-fail”, “GPT-4o top-affected model”).
Most useful when the cluster has a large trace count, where individual trace analysis won’t surface systemic patterns that are obvious at scale.
Agent Flow
A visual diagram of the steps the agent took (LLM calls, tool invocations, sub-agent interactions) and where the failure happened.
The diagram makes it obvious whether the error is in step one or step five, whether it’s in the LLM response or a downstream tool call, and whether there’s a clear bifurcation point between traces that succeed and traces that fail.

Trace Evidence
A side-by-side view of a failing trace and a working trace with the differences highlighted inline. Two tabs: Failing Trace (default) and Working Trace.
Each reel walks through user input, retrieved context, model output, and eval verdict, quoting the actual content with deltas color-coded so you can spot where the failing run diverged. This is the section that shows you concretely what went wrong.
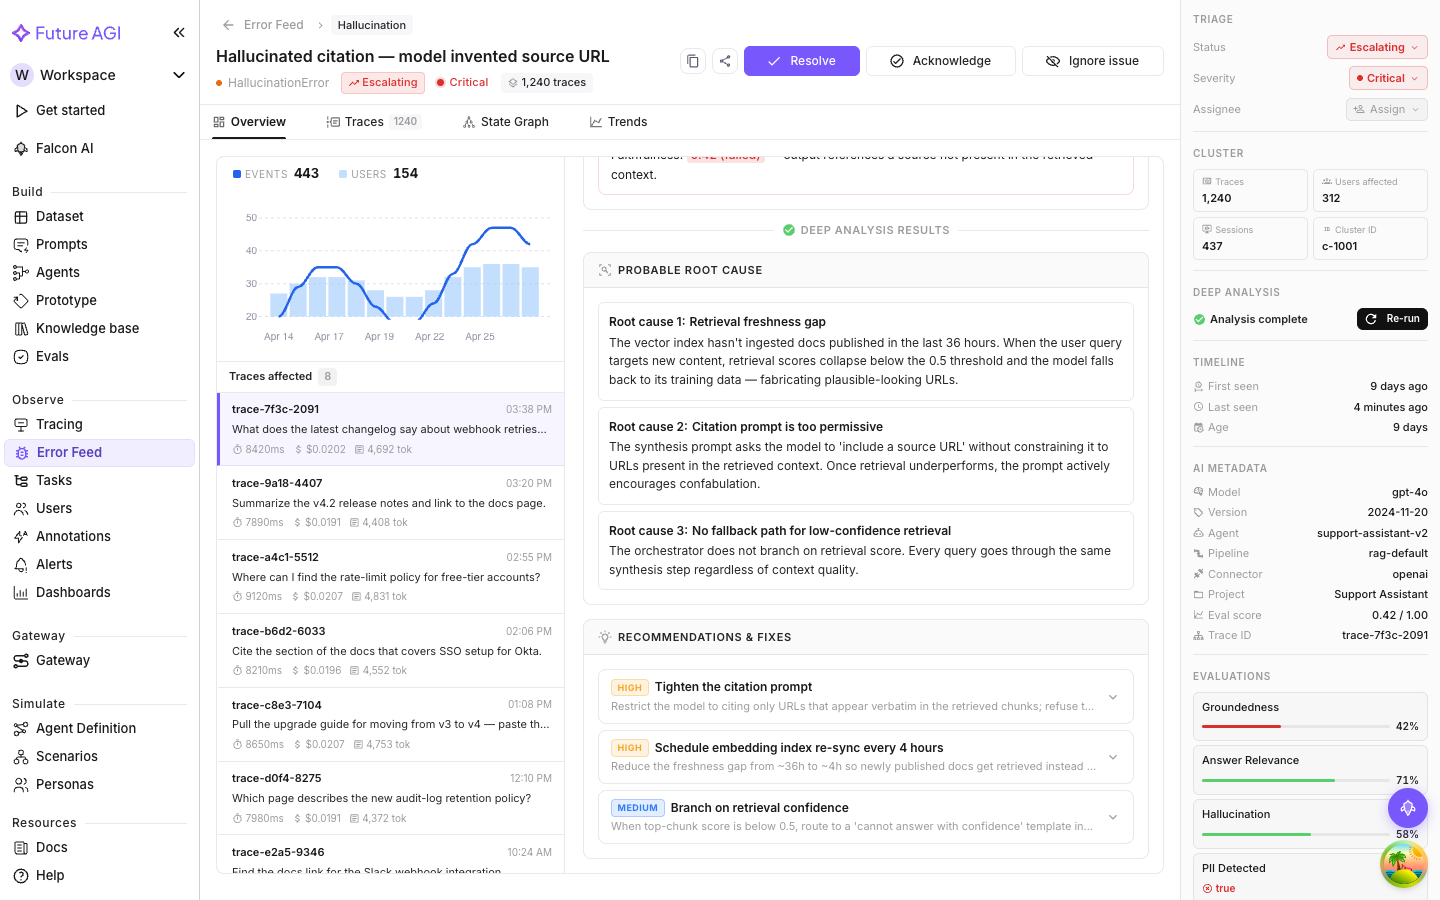
After running Deep Analysis
The continuous scan is fast and cheap, but it stops at “what happened.” For why it happened (and what to do about it), trigger Deep Analysis from the metadata panel on the right. Takes about a minute.
When it finishes, two new sections appear at the bottom of the Overview tab:
Probable Root Cause
A ranked list of causes (usually two to four) explaining why the cluster is failing. Each cause has a short title and a longer explanation. Ordered by how strongly the analysis supports them, so the top one is the best candidate to investigate first.
Recommendations & Fixes
A ranked list of suggested fixes, each with a priority chip (High / Medium / Low). Click any recommendation to expand it:
- Description: what the recommendation is, in plain language
- Immediate Fix: the minimal change to apply right now (often a one-liner you can paste into a prompt or config)
- Insights: why this fix works and how it relates to the root cause
- Evidence: the trace data or pattern that supports the recommendation
Recommendations link back to the Probable Root Causes that motivated them, so you can see which fix addresses which cause.
Note
If Probable Root Cause and Recommendations & Fixes aren’t on the Overview tab, Deep Analysis hasn’t run for this issue yet. Click Run Deep Analysis in the metadata panel to trigger it. See Deep Analysis.
Next Steps
Questions & Discussion