Error Feed State Graph: Agent Decision Flow Diagram
How to read the State Graph tab, the agent decision flow diagram showing where traces diverge between success and failure paths.
About
The State Graph tab visualizes how an agent moves through its workflow and where it fails. It surfaces structural patterns that would take a lot of reading to extract from raw trace data.
Agent Decision Flow
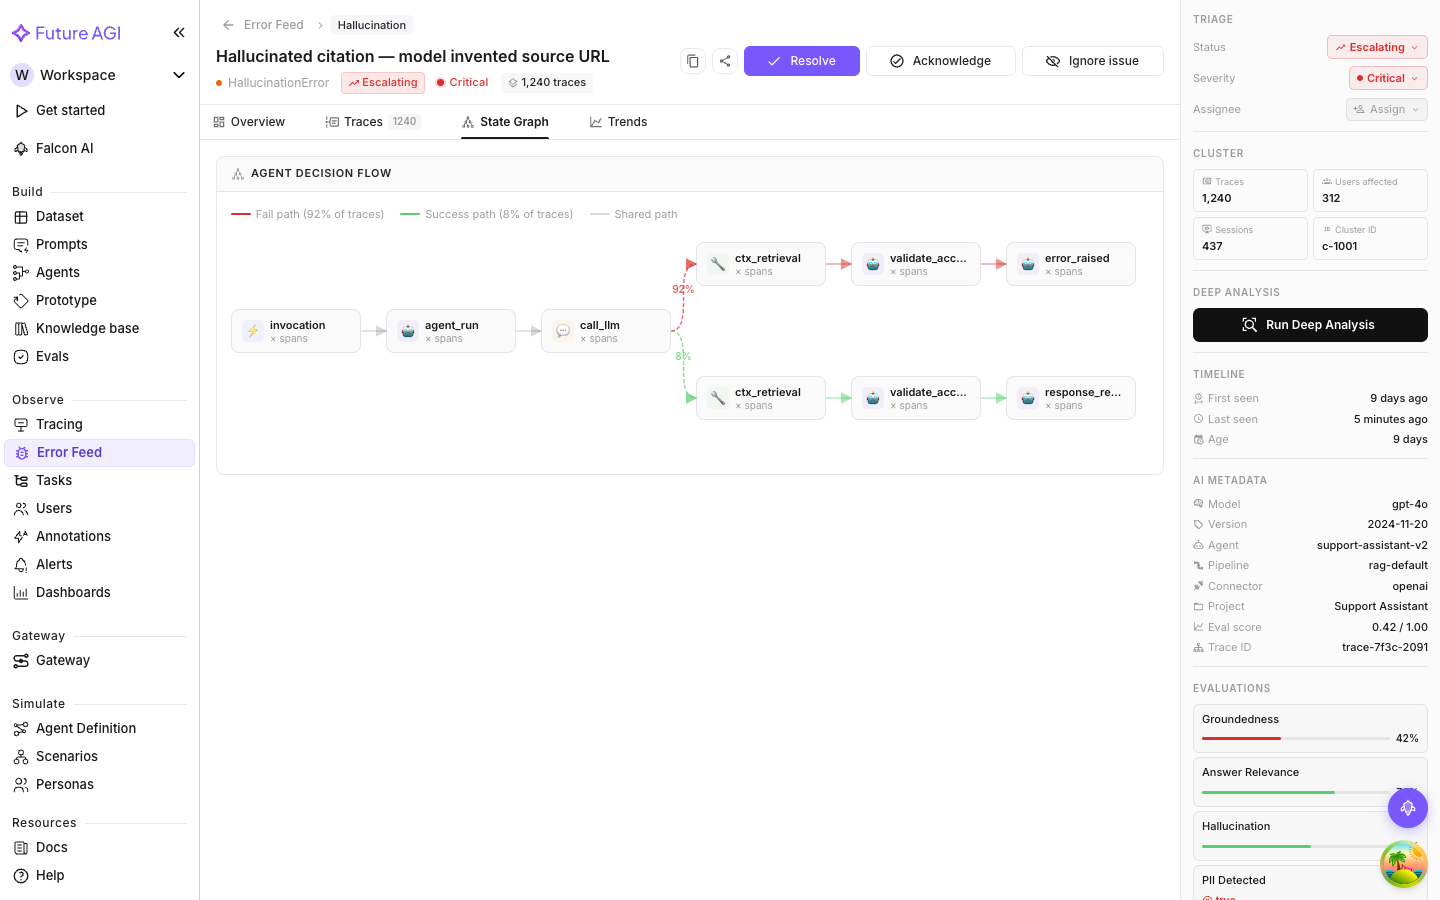
A branching diagram mapping the paths an agent takes from invocation to completion:
- Shared steps: the common entry path every trace follows (invocation, initial LLM call, etc.)
- Fork point: where traces diverge into success and failure paths
- Failure branch: the steps failing traces take, colored red
- Success branch: the steps passing traces take, colored green
- Edge labels: percentages on the fork edges showing what fraction of traces take each path
Read left to right. Steps are nodes; transitions between steps are edges. A step that consistently appears only on the failure path is a strong root-cause candidate.

Reading the fork percentages
The numbers on the fork edges are the most useful signal. If 92% of traces go down the failure path after a particular step, that step is where the problem concentrates. No need to reason about edge cases; the data is telling you where to look.
A near-even split (50/50) means the problem depends on input characteristics, not a systematic code issue. A lopsided split (95/5) means a near-universal failure, probably a configuration or logic error.
Node types
Different step types appear as visually distinct nodes:
| Node type | What it represents |
|---|---|
| Invocation | The agent entry point |
| Agent run | An agent execution step |
| LLM call | A language model inference step |
| Tool execution | A tool or function call |
| Evaluation | An inline quality check step |
| Error | A step that resulted in an error state |
| Success | A step that completed successfully |
When the State Graph is most useful
The State Graph is most useful when:
- The cluster has a moderate-to-large trace count (enough to make the percentages meaningful)
- The agent has multiple steps (single-step agents don’t produce interesting flow diagrams)
- You suspect the failure is structural, tied to a specific workflow path, rather than random
For small clusters or very simple agents, the Overview tab is usually enough. The State Graph earns its keep when you’re looking at a large cluster and want to understand the shape of failure before diving into individual traces.
Relationship to the Overview tab’s Agent Flow
The Overview tab also has an Agent Flow section, but it’s based on the representative trace and shows the narrative flow for that single trace. The State Graph is based on the whole cluster and shows the aggregate picture. Use Agent Flow to understand the specific failure; use State Graph to understand how widespread and how structural it is.
Next Steps
Questions & Discussion