The Error Feed Issue List: Filters, Stats, and Columns
How to read the Error Feed issue list: filters, the stats bar, table columns, trend sparklines, and time range controls.
About
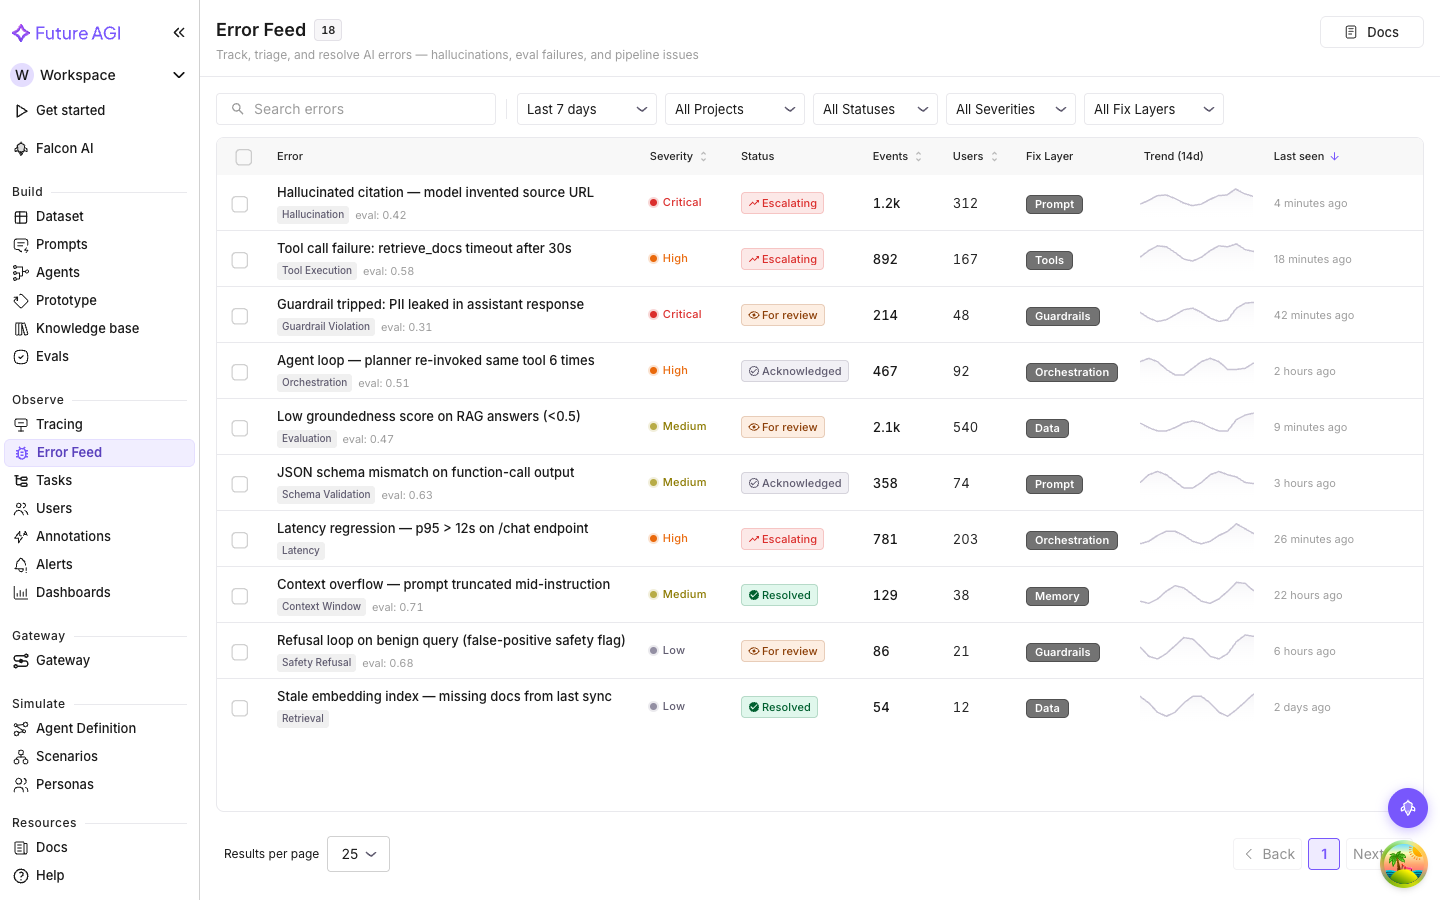
The Feed is the landing page for Error Feed, in the left sidebar under Error Feed. It shows every detected issue across your projects as a filterable, sortable list. This is where you start every triage session.
Filter bar
The filter bar at the top narrows the list to what matters right now.
| Filter | Options |
|---|---|
| Project | Select one or more Observe projects. Defaults to all projects. |
| Time range | Last 24 hours / 7 days / 14 days / 30 days / 90 days |
| Status | Unresolved, Acknowledged, Resolved, Escalating |
| Severity | Critical, High, Medium, Low |
Filters combine. Selecting Critical + Unresolved shows only critical issues that haven’t been acted on.
Tip
Start every session with Unresolved + Critical to see the highest-priority uninvestigated issues first.
Stats bar
The stats bar below the filter gives a snapshot of the current view:
- Total issues: distinct clusters matching the current filters
- Total occurrences: individual trace errors across those clusters
- New issues: clusters that first appeared within the selected time range
These update as you change filters. Use the occurrence count to gauge scope: a cluster with 5 traces is very different from one with 500.
Issue table
Each row in the table represents one issue (cluster). The columns are:
Error name
A human-readable name for the cluster, generated from the error pattern. This is what you read to figure out what’s going wrong — e.g. “Tool parameter validation failed on search_docs” or “Hallucinated product availability”.
Severity
Critical (red), High (orange), Medium (yellow), Low (gray). See Severity and Status for what each level means and how to change it.
Status
Current triage status: Unresolved, Acknowledged, Resolved, or Escalating. Issues you haven’t looked at yet stay Unresolved.
Traces
Number of individual traces grouped into this cluster. A high trace count means the error is recurring frequently.
Trend
A sparkline showing how often this error appeared over the selected time range. Upward trend, getting worse. Flat, stable. Downward, resolving on its own (or you fixed something upstream).
A directional indicator next to the sparkline shows the same thing at a glance.
Clicking an issue
Click any row to open the issue detail page. It has four tabs (Overview, Traces, State Graph, Trends) and a metadata panel on the right.
See the feature pages for each:
Issue Overview
Description, root cause, evidence, and recommendations.
Traces
All traces in the cluster.
State Graph
Visual breakdown of where and how the agent failed.
Trends
Error frequency, score trends, and activity heatmap.
Navigation tip
The list remembers your last filter state within a session. Open an issue, hit the breadcrumb to go back, and your filters are still applied.
Next Steps
Questions & Discussion