Alerts and Monitors: Observe Metric Threshold Notifications
Define monitors on Observe project metrics (system or evaluation) and get notified by email or Slack when values cross a threshold.
About
Alerts and monitors notify you when a metric goes above or below a value you set. Pick a metric (error rate, latency, cost, or an eval score), define a threshold, and choose where to get notified: email, Slack, or both. Monitors check the metric on a schedule. If the threshold is breached, you get an alert. You can review past alerts, mark them resolved, or mute a monitor without deleting it.
When to use
- Catch errors early: Get notified when error rate or API failure rate spikes after a deployment.
- Stay within latency limits: Alert when response time goes above your target.
- Control costs: Track token usage and get a warning before you hit your budget.
- Monitor eval quality: Know when a pass/fail eval like toxicity starts failing more often.
- Stay informed without watching dashboards: Send alerts to email, Slack, or both.
How to
Choose the metric
Create a monitor for an Observe project and select the metric type:
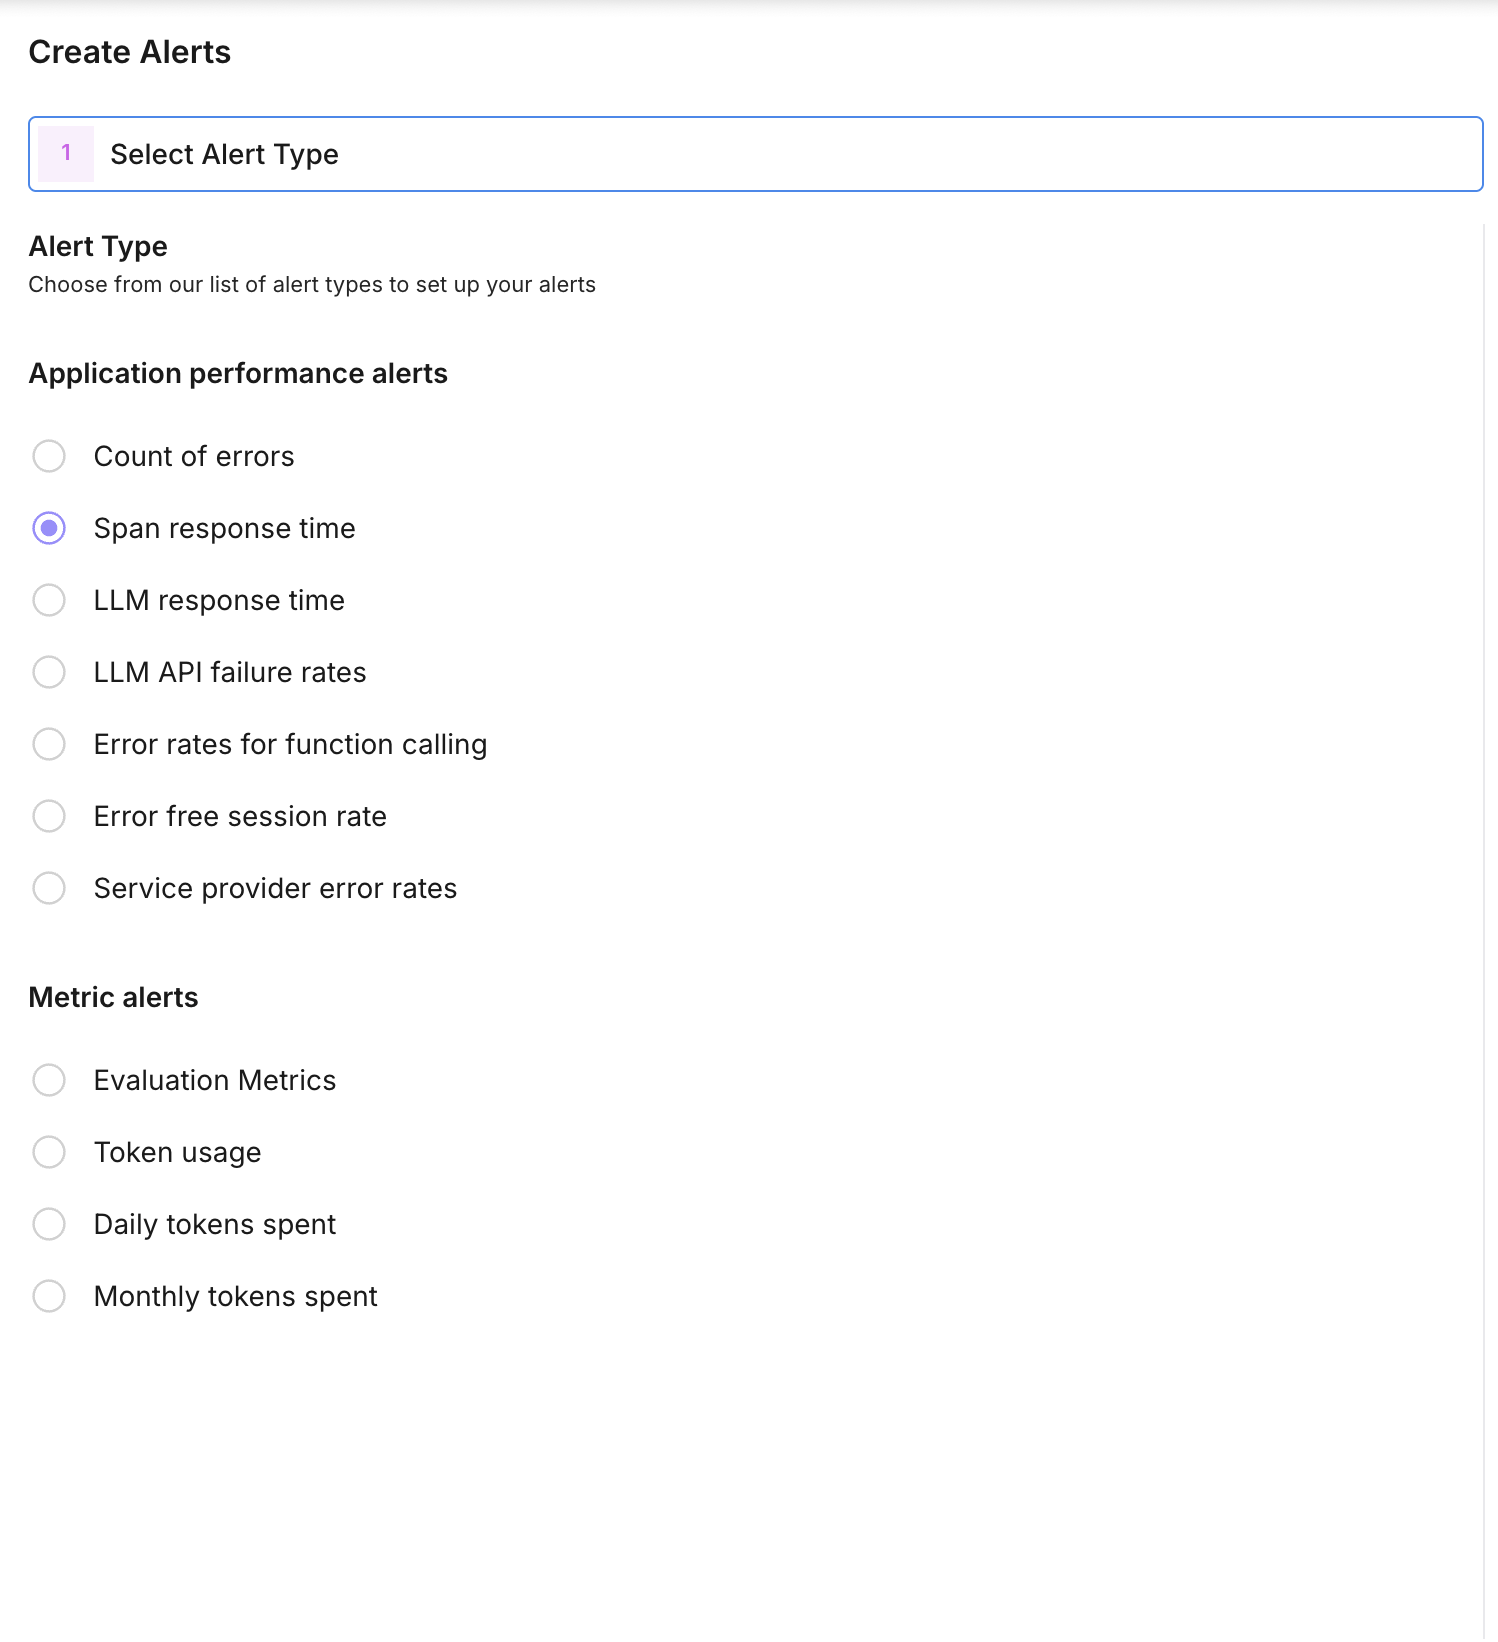
- System metrics: count of errors, error-free session rates, LLM API failure rates, span response time, LLM response time, token usage, daily/monthly tokens spent.
- Evaluation metrics: attach an eval config for that project. For pass/fail or choice evals you can set threshold_metric_value to the specific value to monitor (e.g. fail rate or a choice label).
The monitor is scoped to one project (Observe projects only).
Define the threshold
Set how the alert is triggered:
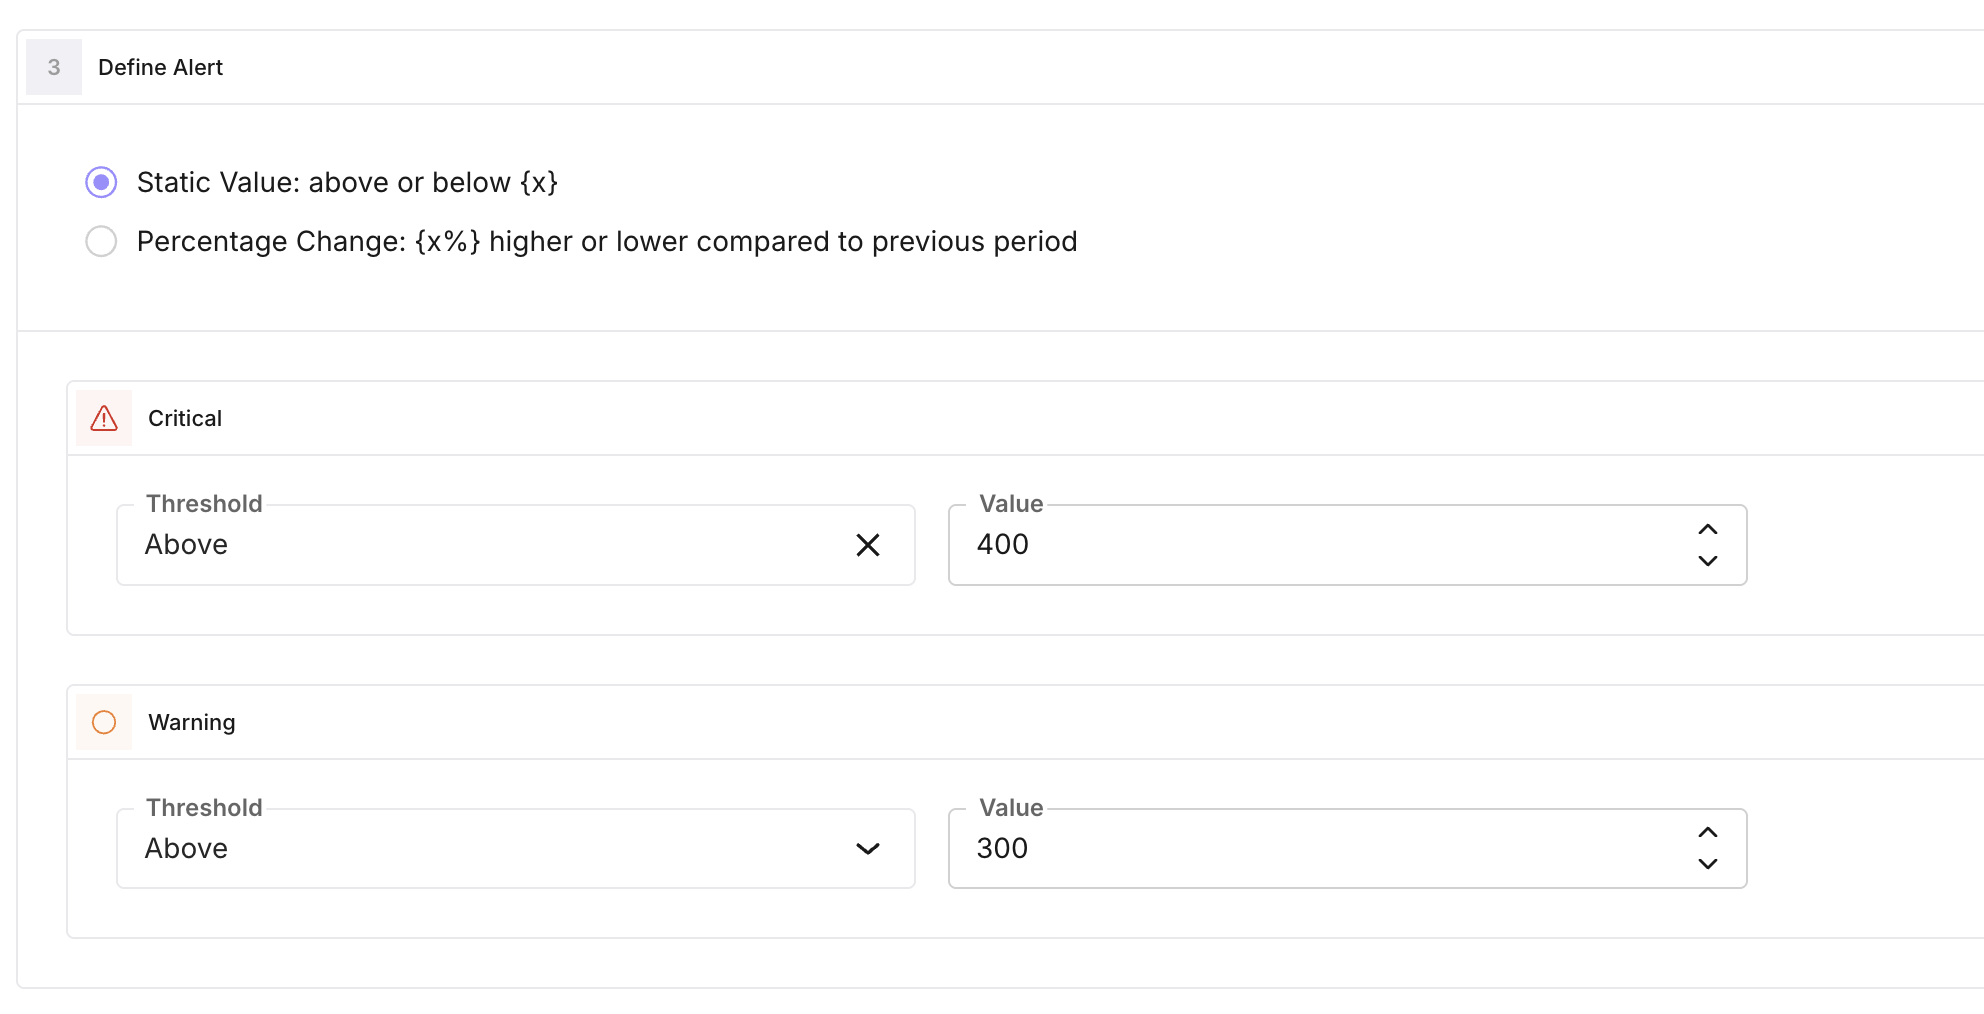
- threshold_operator: Greater than or Less than (the current metric value is compared to the threshold).
- threshold_type: how the threshold is determined:
- Static: you set fixed critical_threshold_value and optionally warning_threshold_value. Alert fires when the metric is greater than (or less than) these values.
- Percentage change: threshold is based on percentage change from a baseline (e.g. historical mean over a time window). You set critical_threshold_value and optionally warning_threshold_value as percentage values. auto_threshold_time_window (default one week, in minutes) defines the window used to compute the baseline.
When the condition is met, the system creates an alert log (critical or warning) and triggers notifications.
Set alert frequency
alert_frequency is how often the monitor is evaluated, in minutes (minimum 5, default 60). The monitor runs on this schedule and checks the metric over the relevant time window. If the threshold is breached, an alert is created and notifications are sent.
Configure notifications
- Email: add up to five addresses in notification_emails. They receive an email when an alert is triggered (subject and body include alert name, message, and type).
- Slack: set slack_webhook_url to your Slack incoming webhook. Optional slack_notes are included in the message.
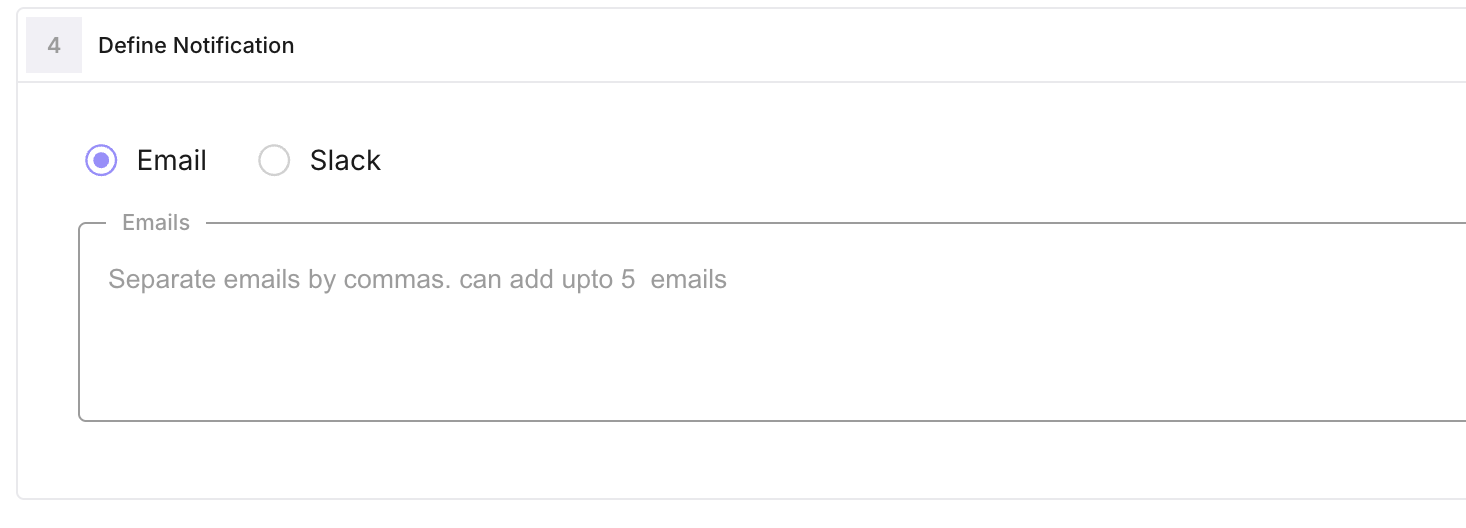 You can use email only, Slack only, or both. Mute a monitor with is_mute to stop notifications without deleting it.
View and resolve alerts
Alert history is stored as UserAlertMonitorLog records (critical/warning, message, time window, link). You can list logs for a monitor, see when each alert fired, and mark them resolved. Use the monitor detail view in the UI to see trend data and unresolved count.
Note
Monitors are only available for projects with trace_type observe. Optional filters (same structure as eval-task filters) can narrow which spans are included when computing the metric.
Next Steps
Questions & Discussion