Explore sessions & users
Read, filter, and sort the Sessions and Users views in Observe.
Once your spans carry session.id and user.id, Observe groups them into two views: Sessions, one row per conversation, and Users, one row per end user. This page is how to read, filter, and sort them. To attach the IDs in the first place, see Set session and user IDs; for the concepts, see Sessions and Users.
The Sessions view
Open the project and switch to the Sessions tab. Each row is one conversation.
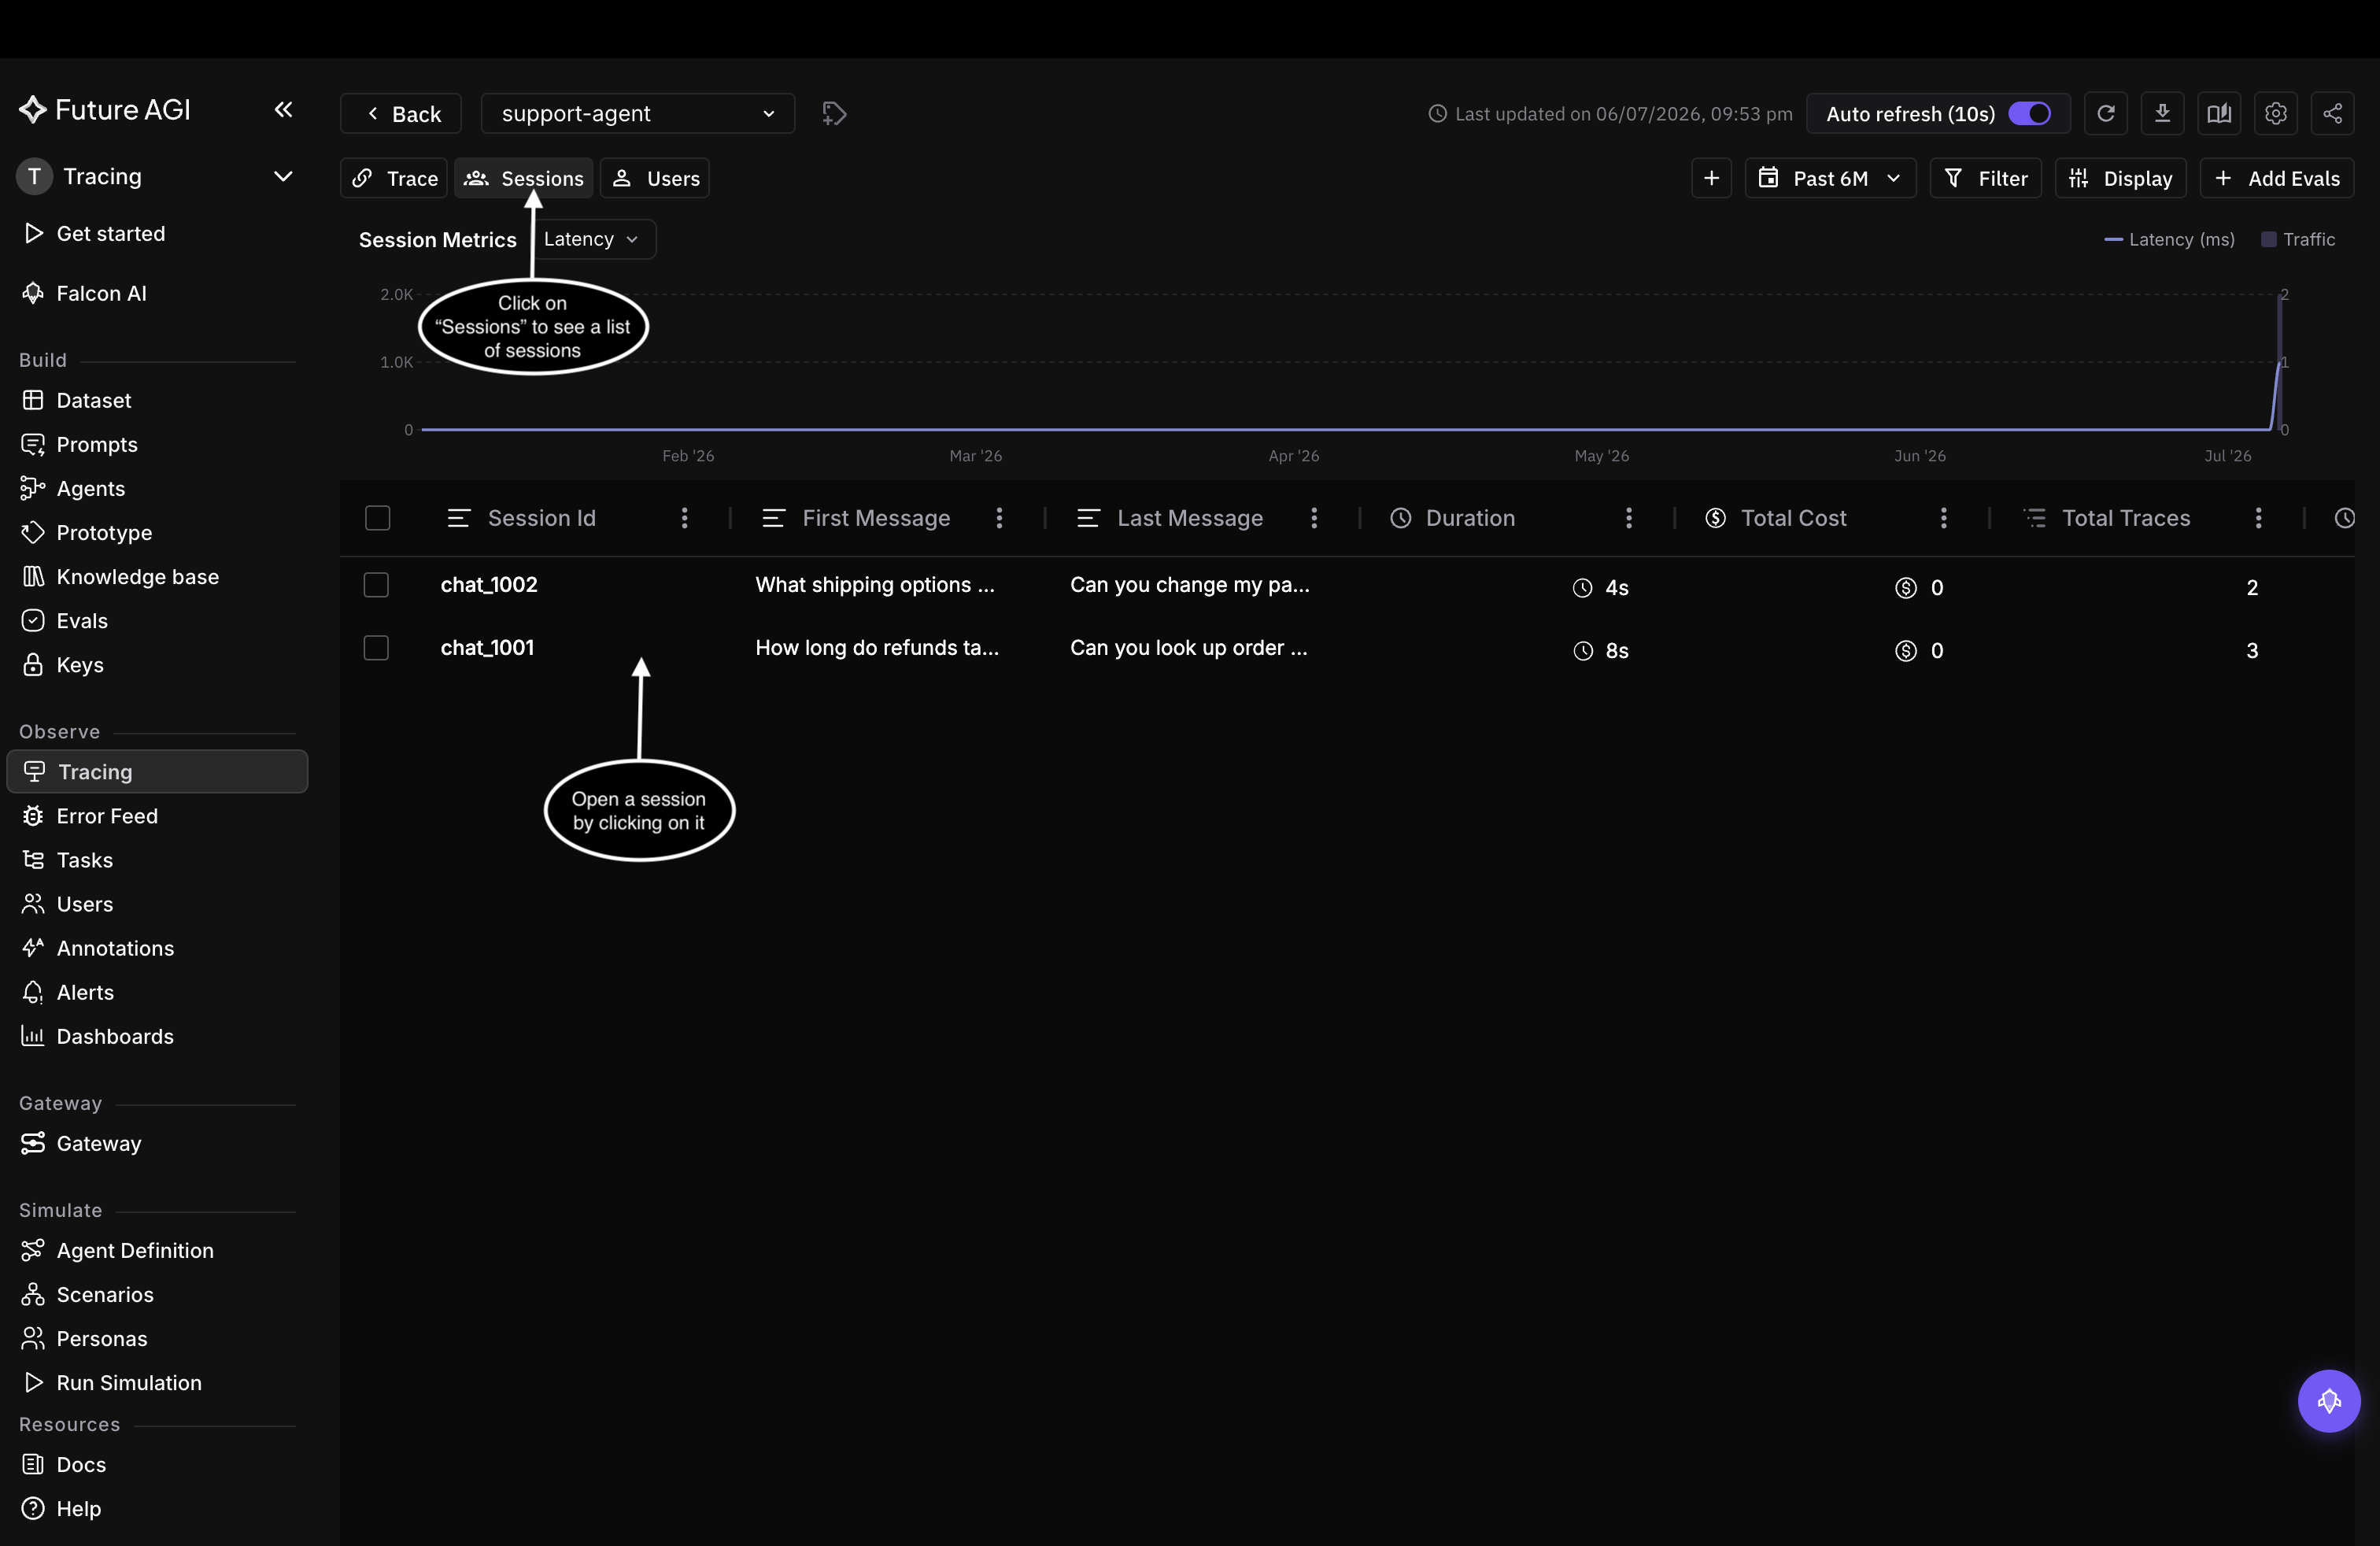
One row per conversation. Sort by total cost or total traces to find the longest or most expensive sessions.
The columns roll each conversation up at a glance:
| Column | What it shows |
|---|---|
| Session Id | The shared identifier for the conversation |
| First Message | The opening message |
| Last Message | The most recent message |
| Duration | How long the conversation lasted |
| Total Cost | Combined cost of all calls in the session |
| Total Traces | How many requests were part of it |
Open a session for its detail view, the traces in order, each with its eval scores and annotations. From there you open any trace for the full span tree.
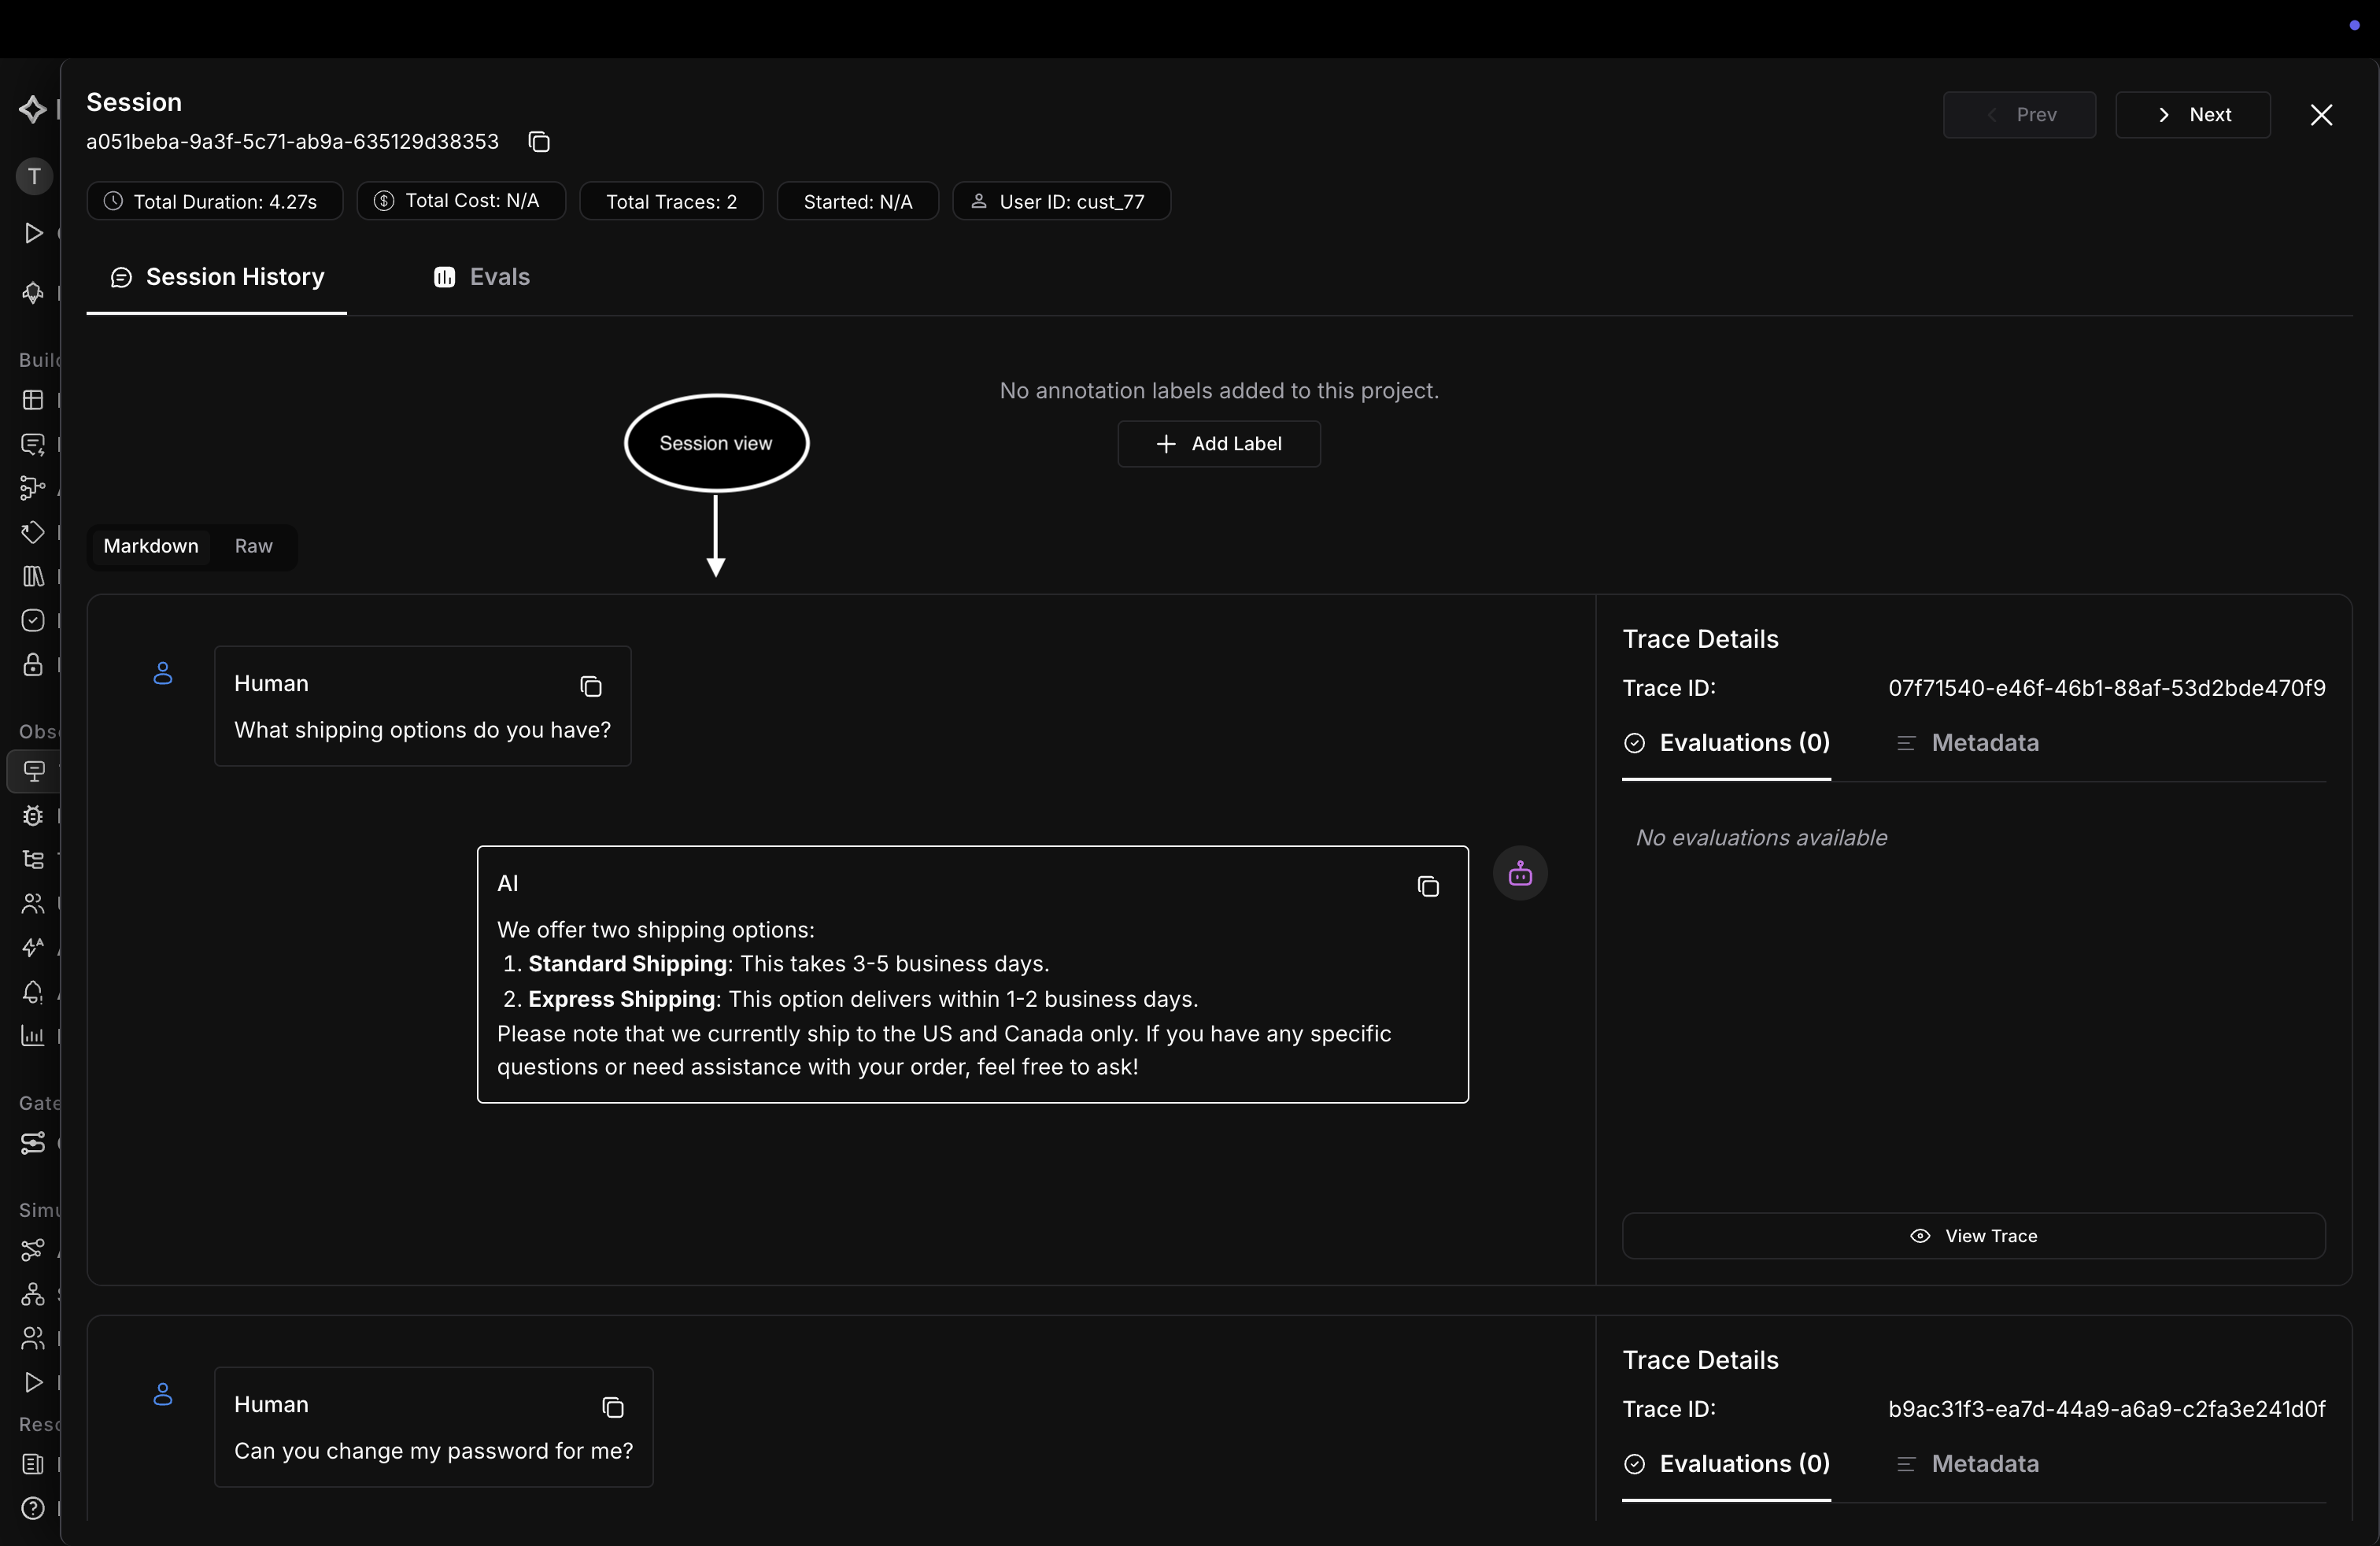
A session opened: the conversation turn by turn, with each turn’s trace, evals, and metadata.
Narrow the list with the filter bar, by session.id, metadata, or any span attribute (see the filter syntax reference), and scope it to a time window with the date-range picker, which recomputes the column metrics for the window. For voice and other replayable sessions, configure session replay to step back through a conversation as it happened.
The Users view
Switch to the Users view. Each row is one end user.
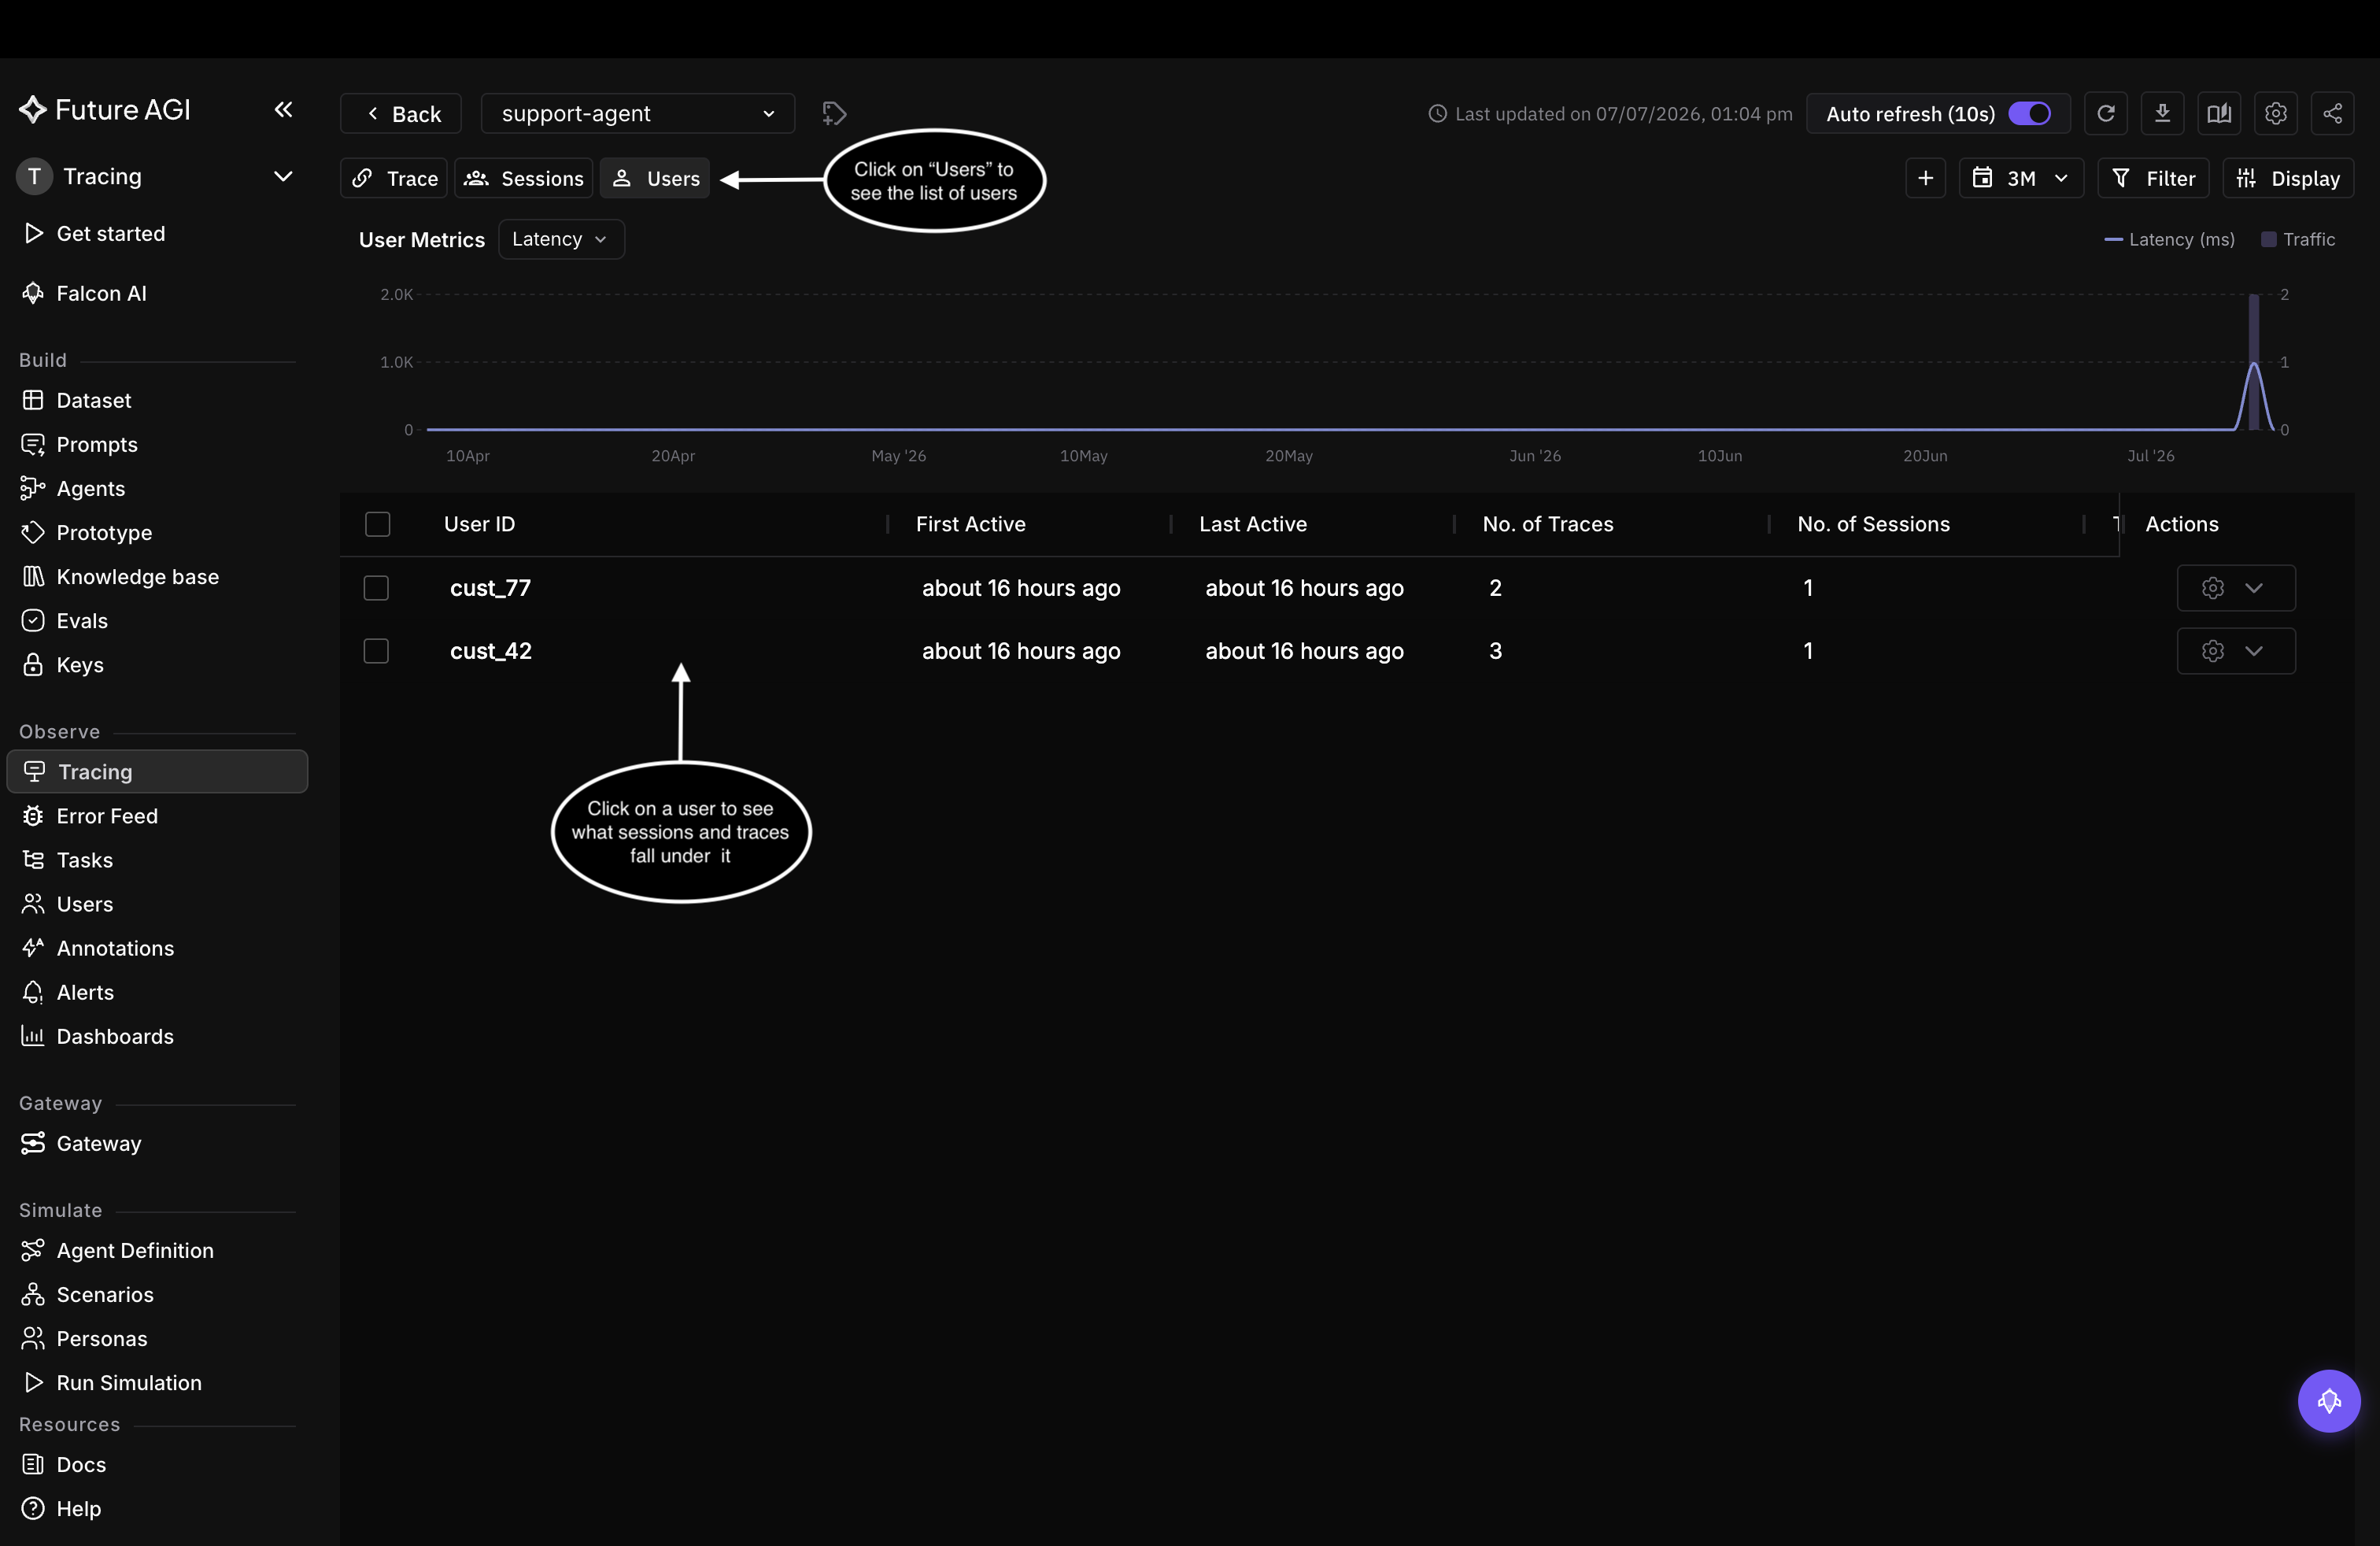
One row per user, with trace and session counts rolled up. Sort by trace or session count to find your most active users.
The columns roll each user up:
| Column | What it shows |
|---|---|
| User ID | The user.id value you set in code |
| First Active | When the user’s first trace arrived |
| Last Active | When their most recent trace arrived |
| No. of Traces | How many traces are attributed to the user |
| No. of Sessions | How many conversations they had |
Open a user for their detail view, where cost, evals, and guardrail results break down per session and trace, across a Traces tab and a Sessions tab.
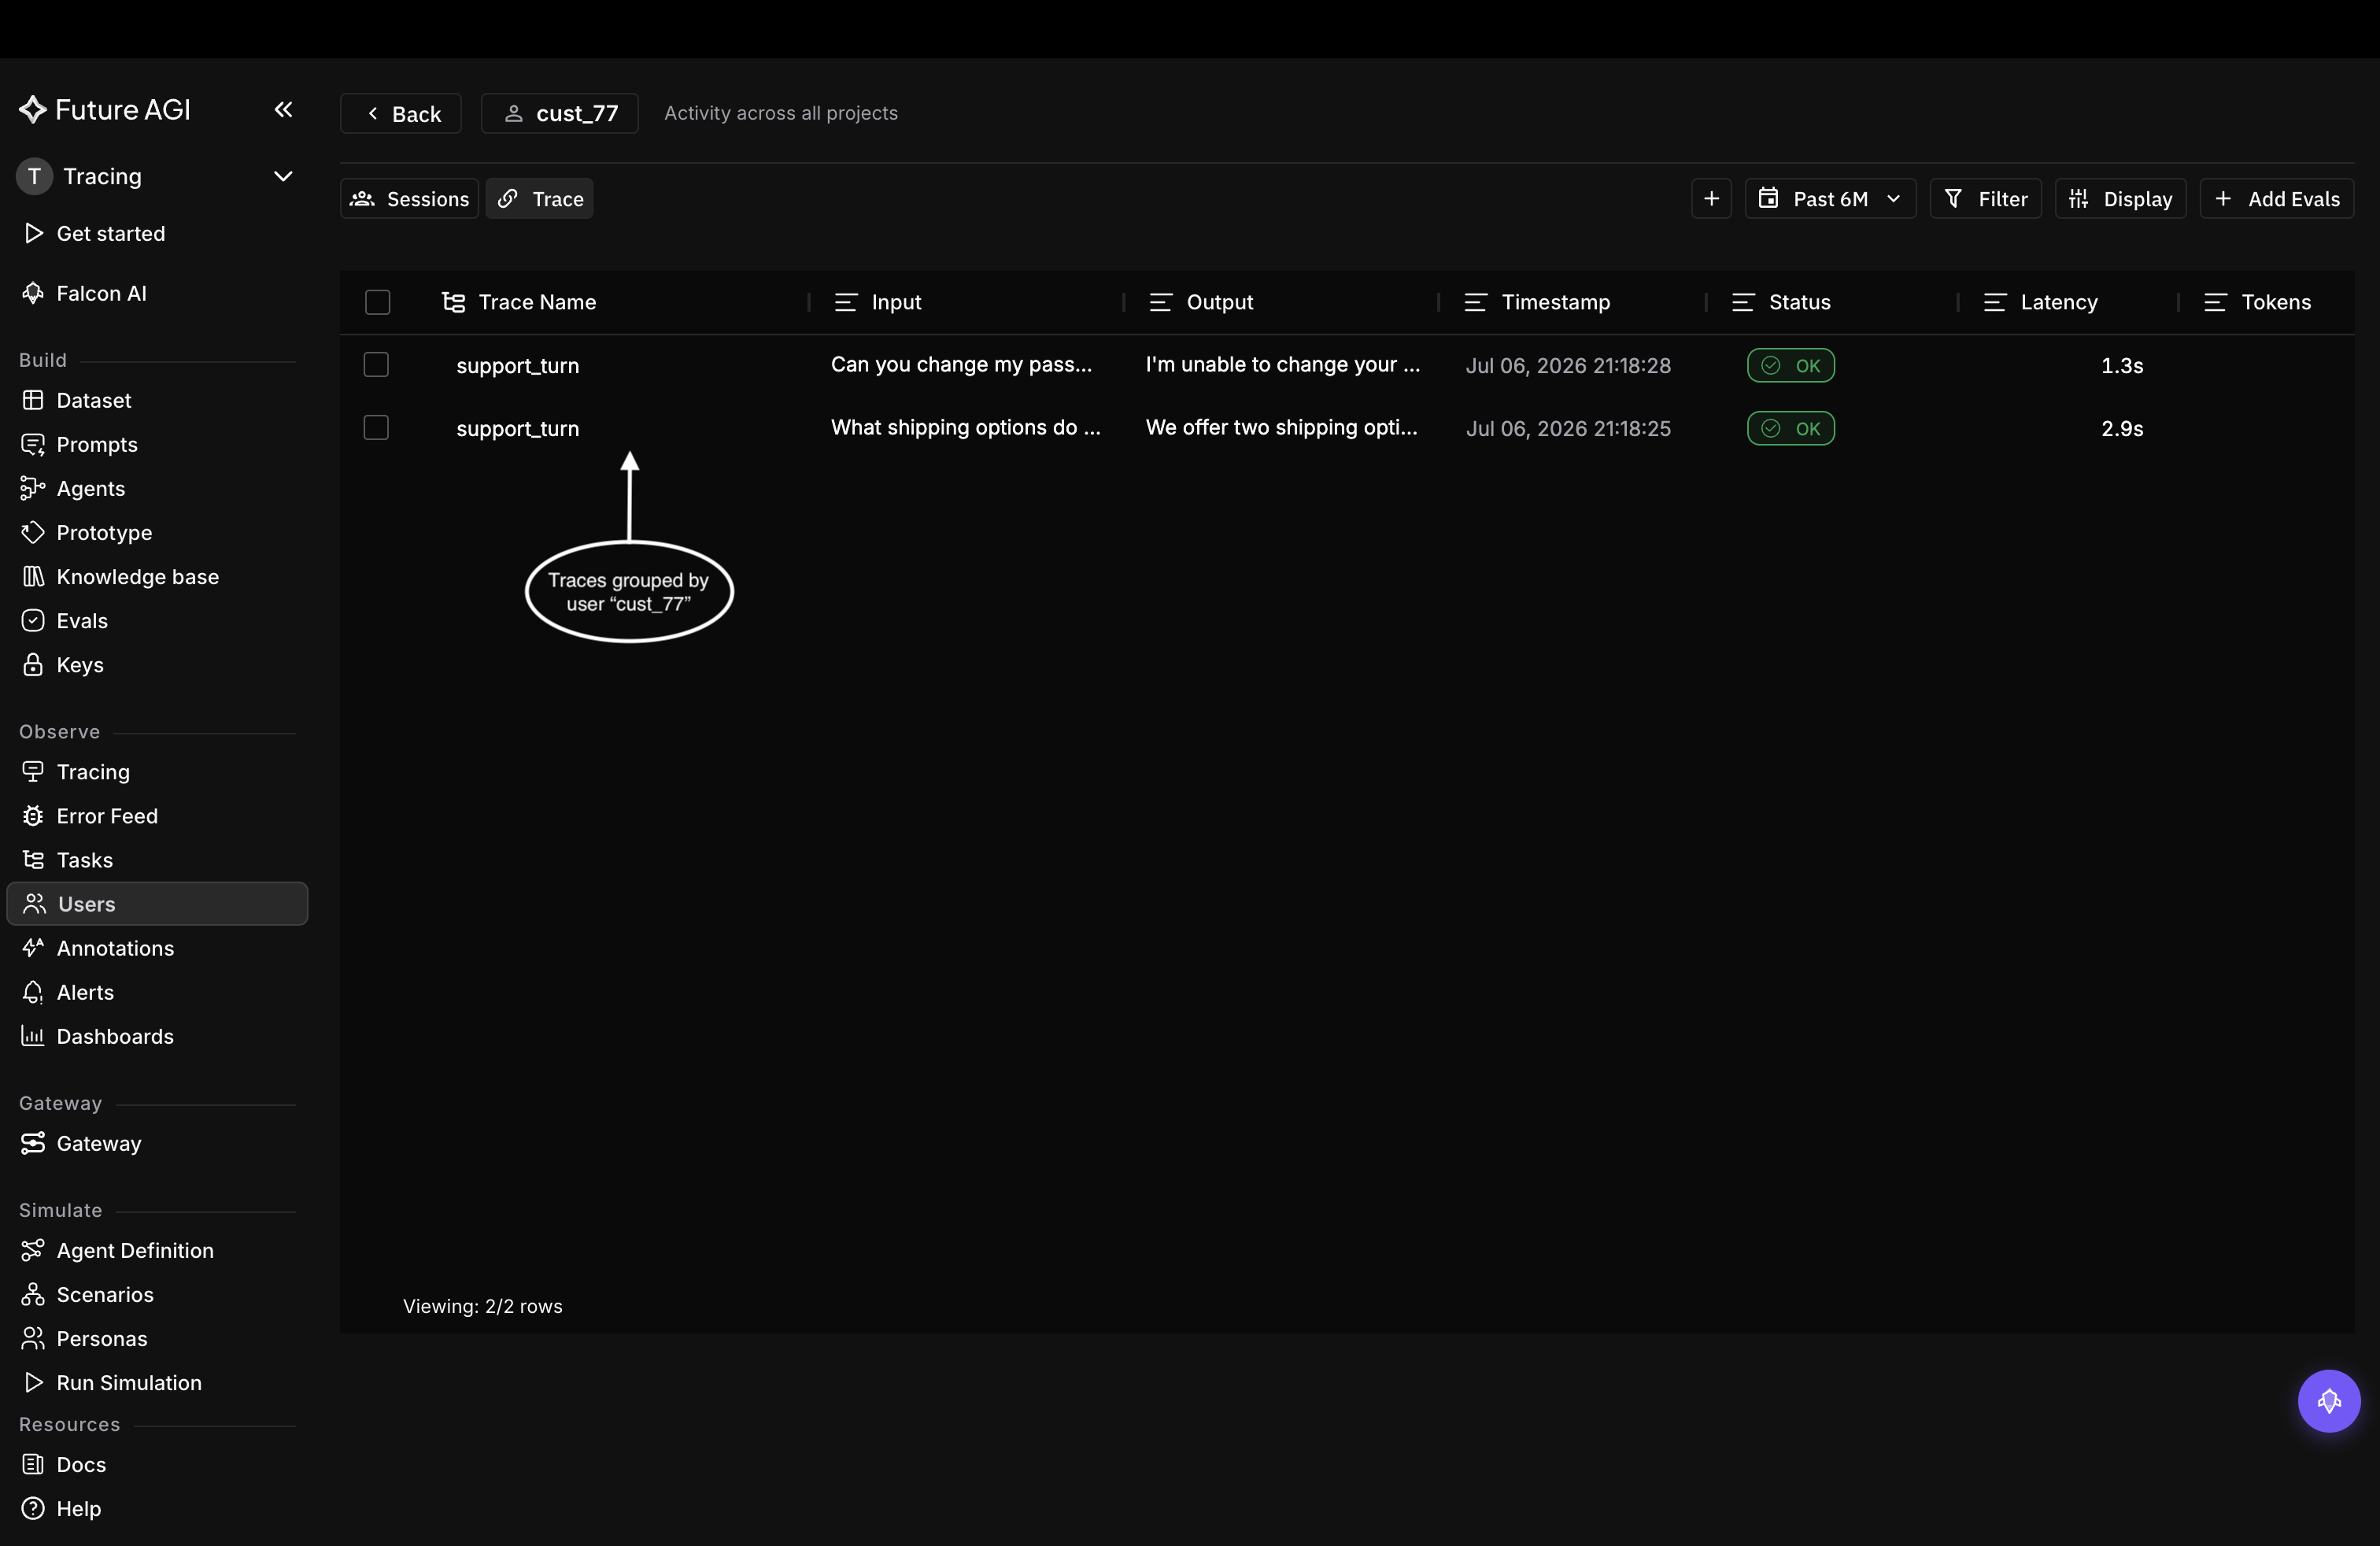
The Traces tab: every trace attributed to cust_77.
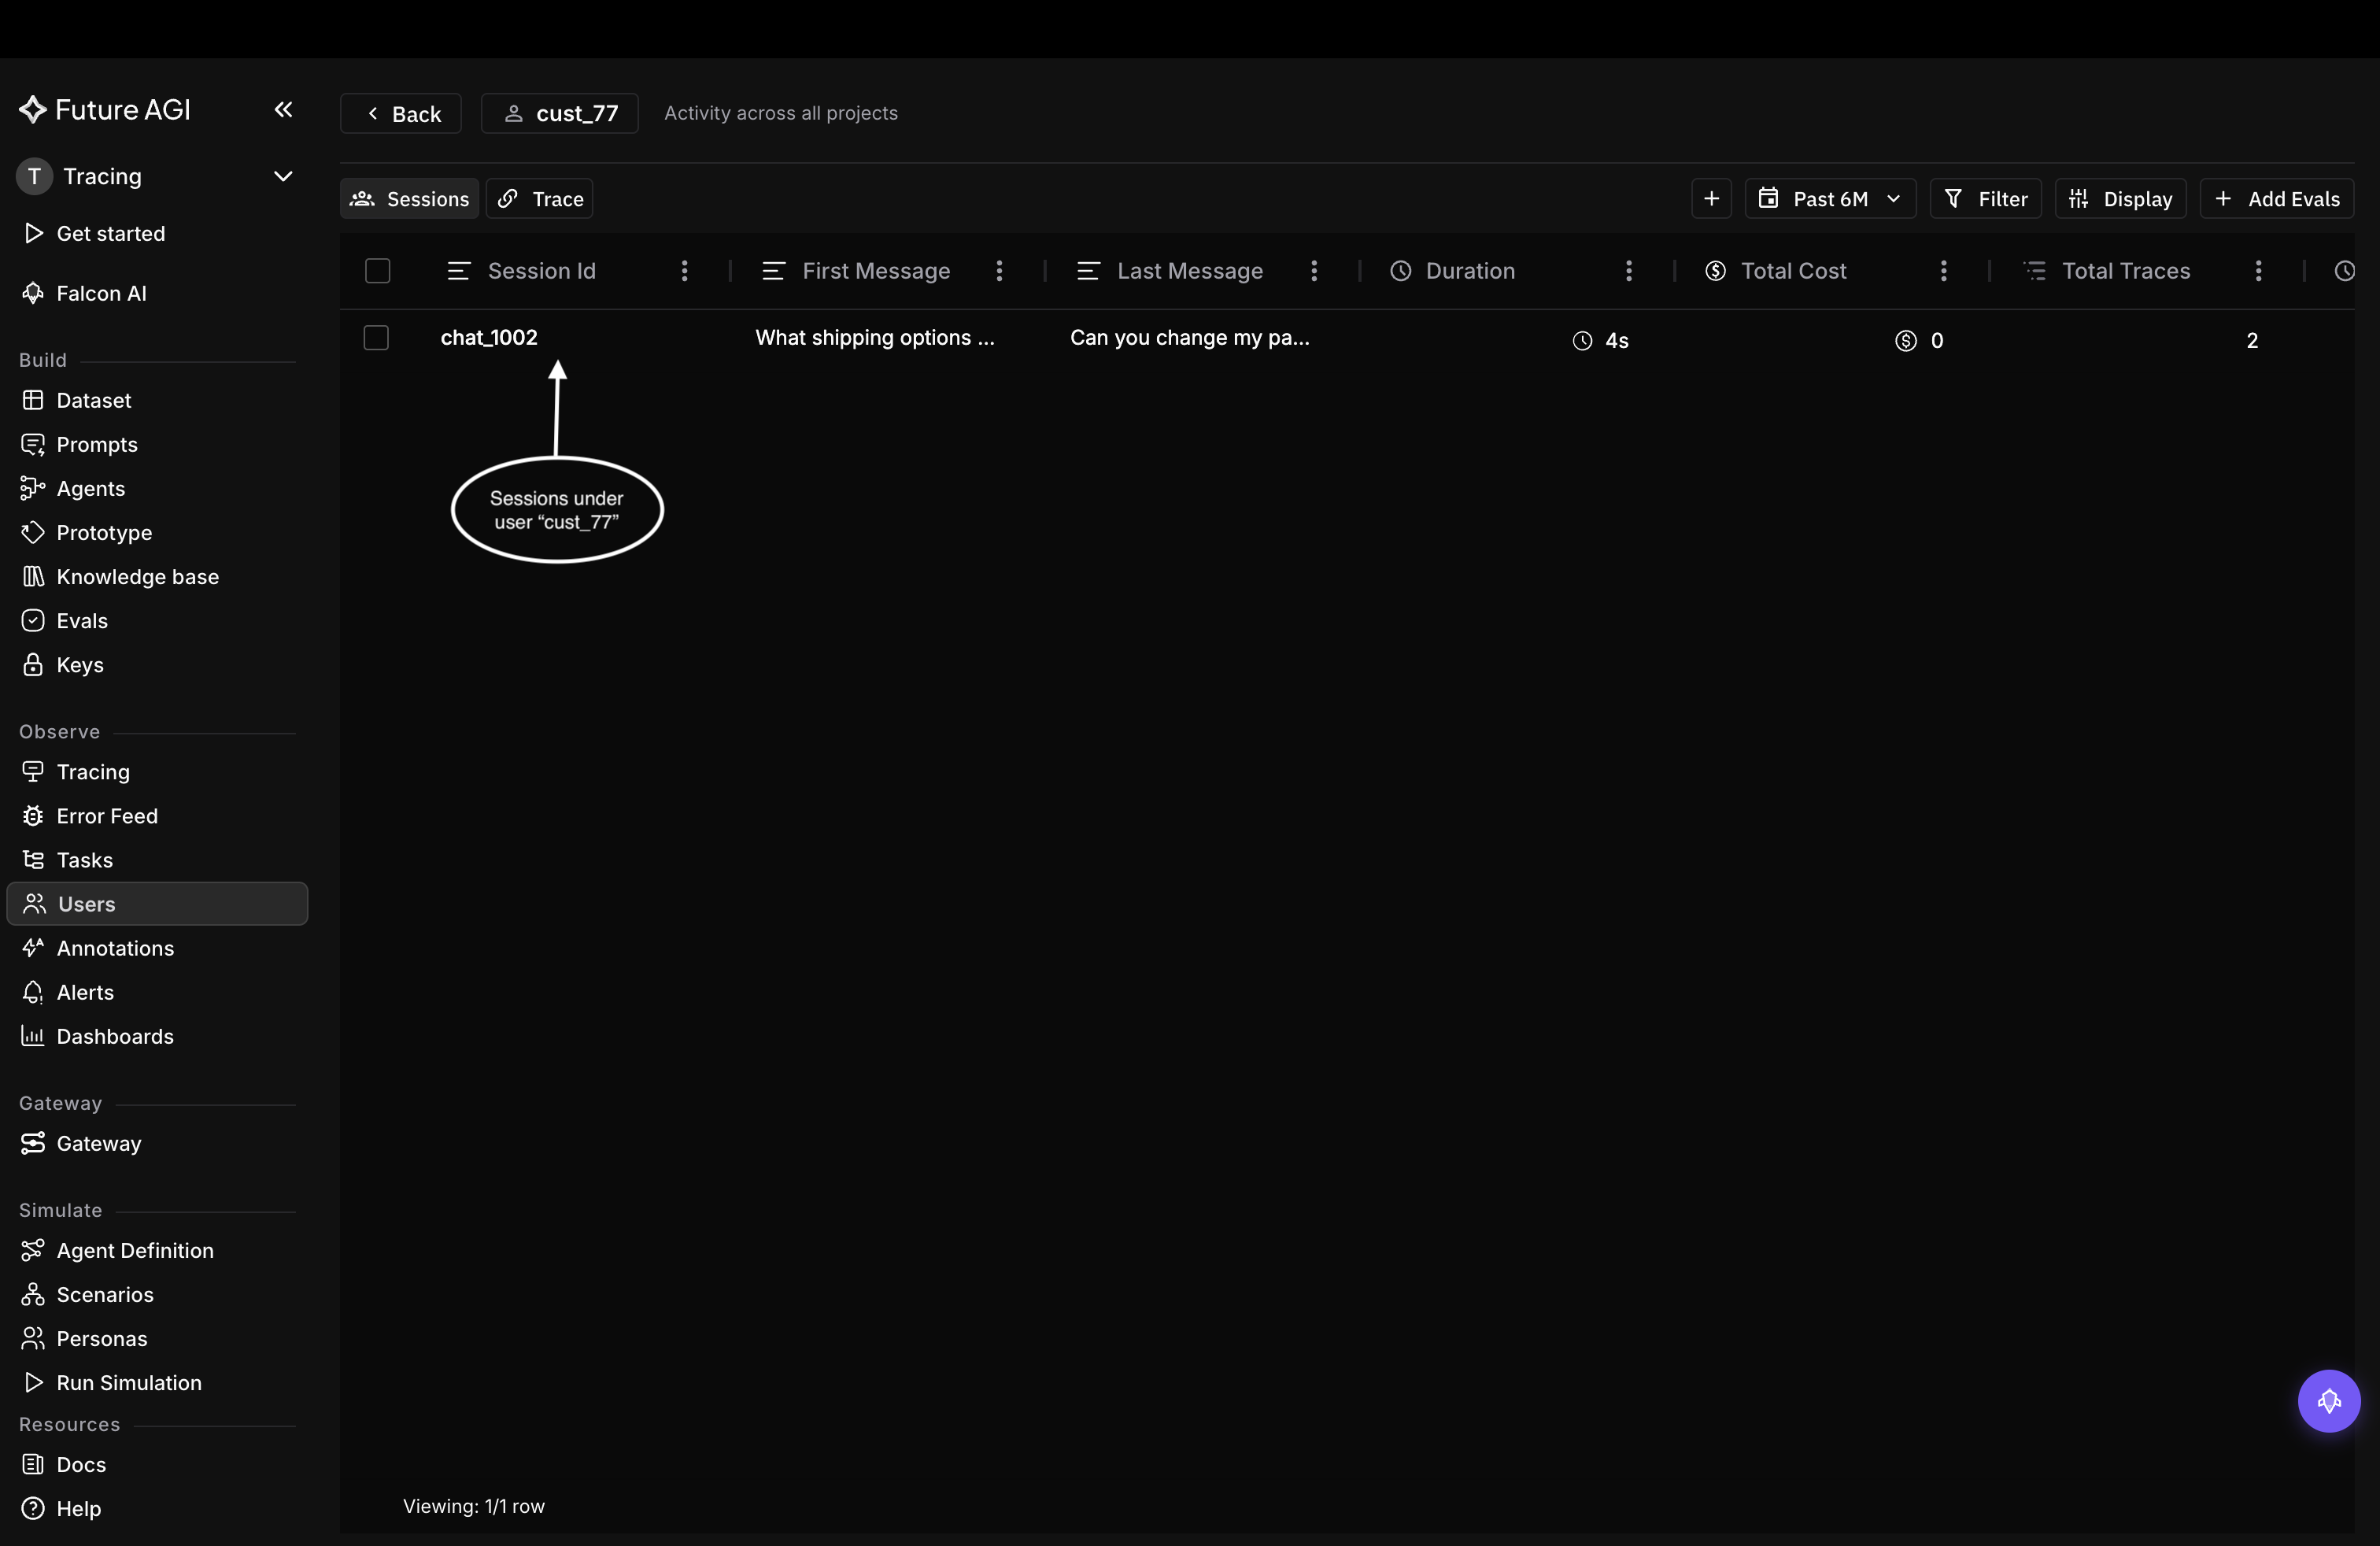
The Sessions tab: every conversation cust_77 had.
Filter and scope the same way as sessions, by user.id, metadata, or any span attribute, and by date range.
Not seeing your groupings?
| Symptom | Cause | Fix |
|---|---|---|
| Traces not grouping | The call ran outside the using_session / using_user block, so spans never got the ID | Make the call inside the block (or a decorated function) |
| One conversation split across sessions | A different session.id was used on some turns | Reuse one stable string for the whole conversation |
| One person split across users | A different user.id was used on some requests | Reuse one stable string for that person |
| Row exists but no metrics | Spans carried the ID but no cost or token attributes | Confirm the LLM spans are auto-instrumented |
For every way to attach the IDs, see Set session and user IDs.
Related
Questions & Discussion