Dashboards: Custom Metric Visualization in Observe
Build custom dashboards with widgets to visualize your Observe project metrics, traces, and performance data in one place.
About
Dashboards let you create custom views of your project data. Each dashboard is a collection of widgets, and each widget runs a query against your data and displays the result as a chart or table. You can track error rates, latency, token usage, eval scores, or any metric from your spans and experiments. Dashboards work across project types and are shareable across your team.
When to use
- You want a single view of key metrics: Combine error rate, latency, cost, and eval scores into one dashboard instead of switching between pages.
- You need to monitor a deployment: Create a dashboard with widgets that show the metrics you care about, then filter by time range to see how things changed after a release.
- Your team needs a shared overview: Build a dashboard that everyone on the team can open to see the current state of the project.
- You want to compare metrics side by side: Place multiple widgets on the same dashboard to spot correlations between latency spikes and error rate increases.
- You need to export or present data: Use table widgets to view raw data and export it as CSV.
How to
Create a dashboard
Open the Dashboards section and click Create Dashboard. Give it a name and optional description.
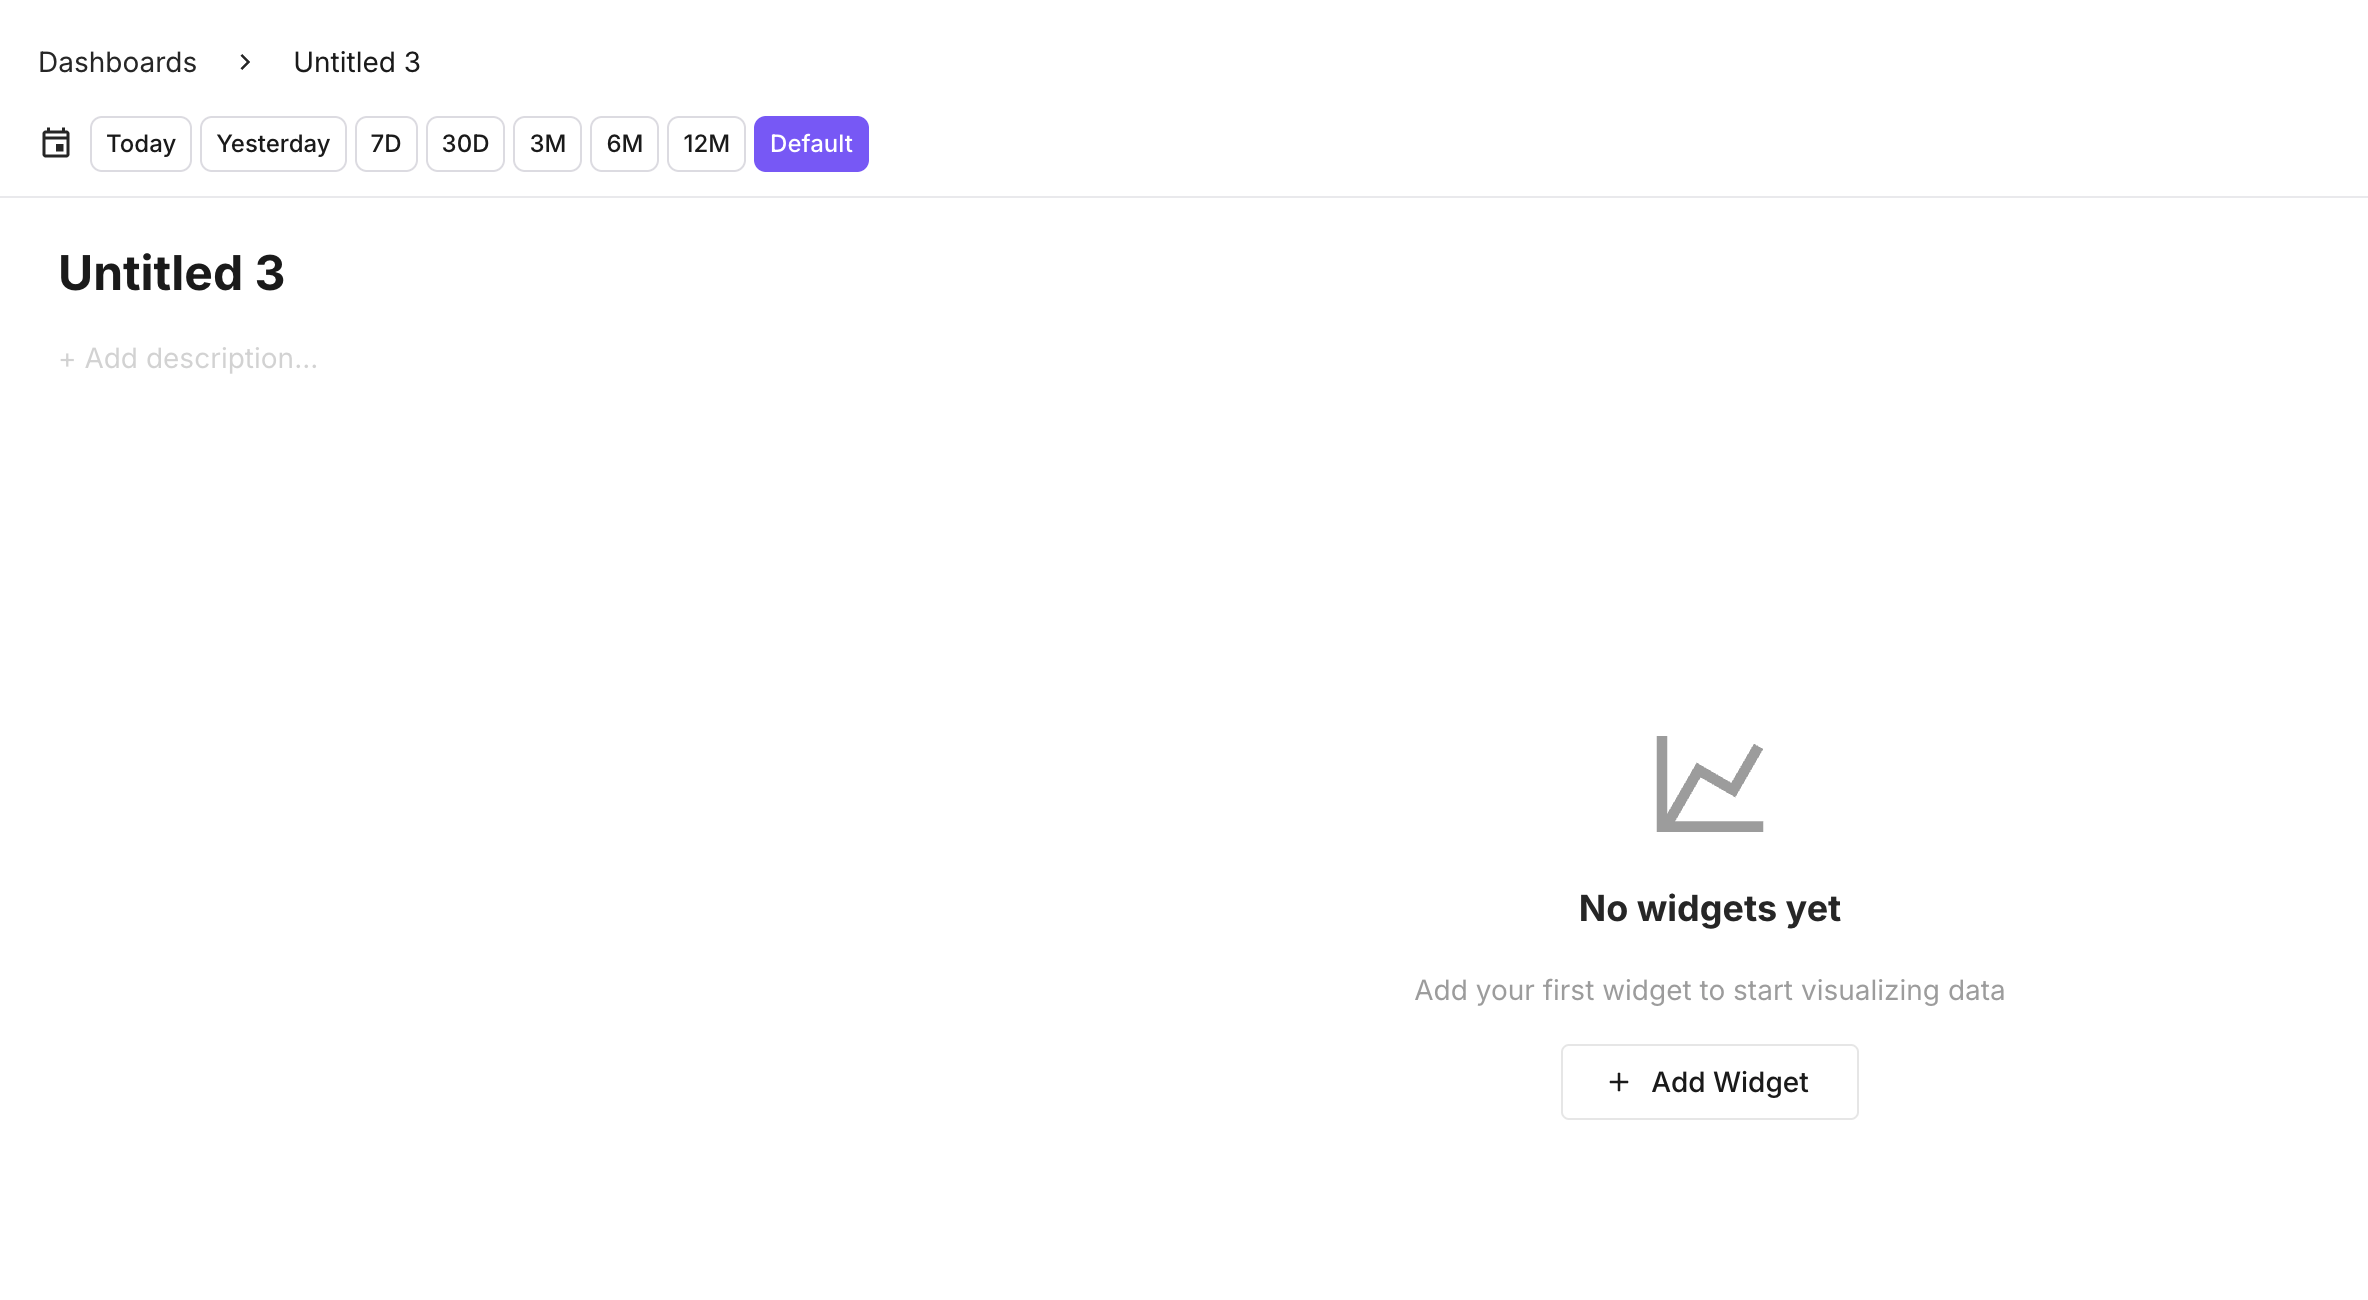
Add a widget
Click Add Widget and configure the query:
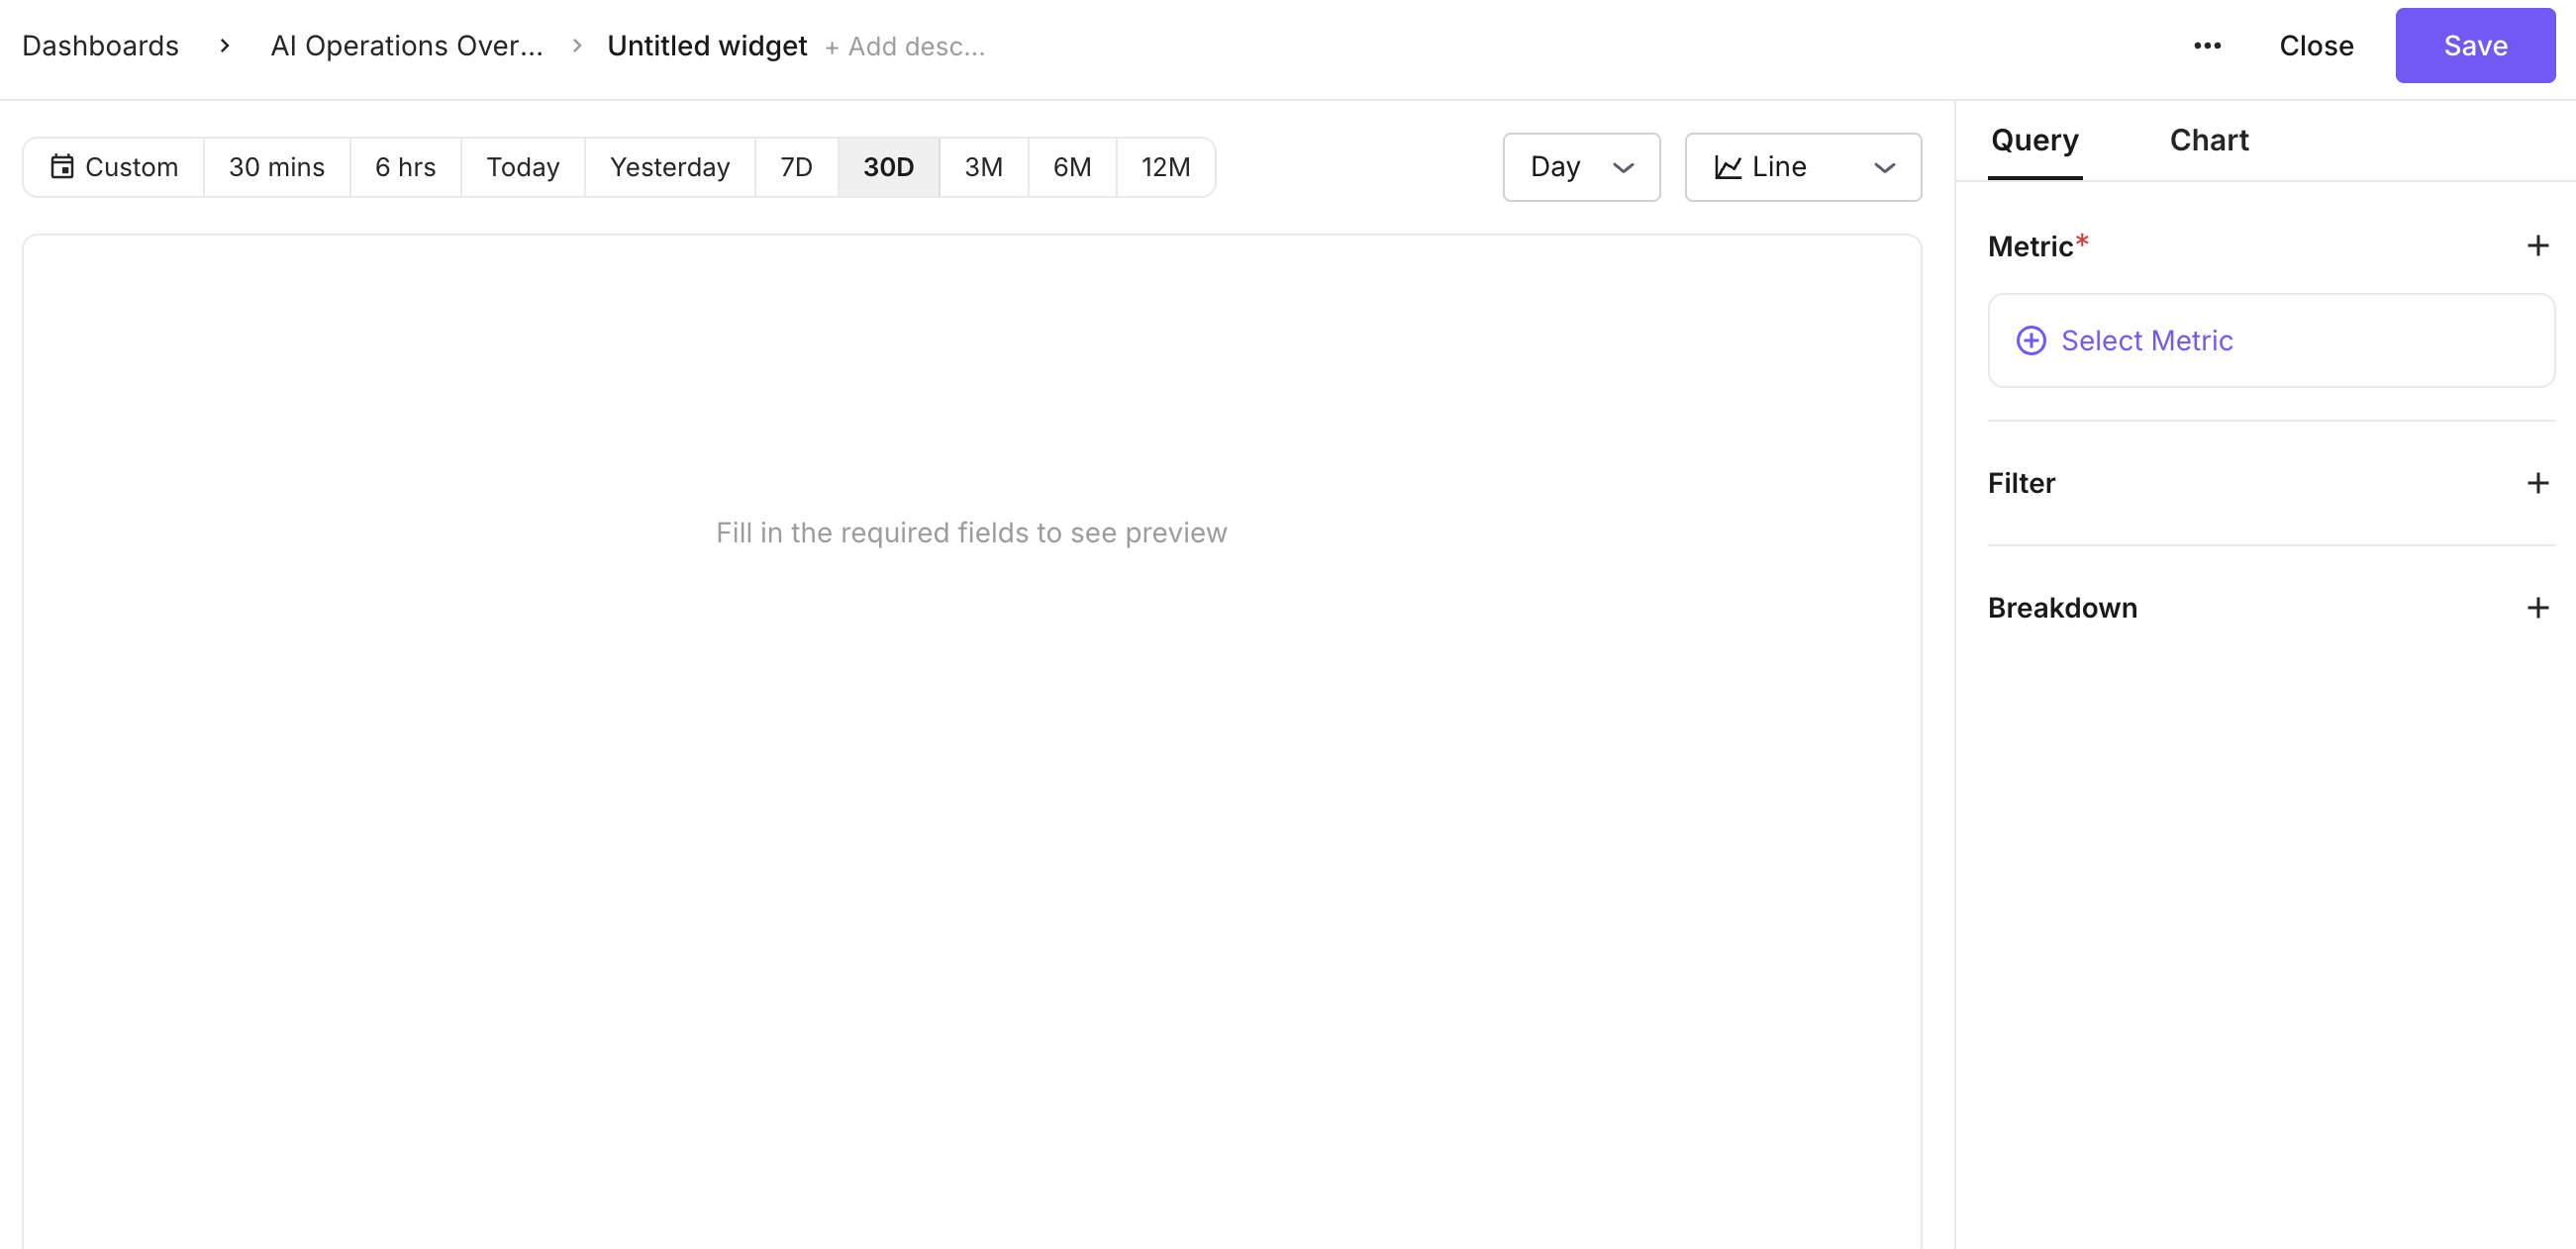
- Chart type: line, stacked line, column, stacked column, bar, stacked bar, pie, table, or metric (single number).
- Metric: select from available metrics (e.g. span count, error count, latency, token usage, eval scores).
- Aggregation: sum, average, median, count, distinct count, min, or max.
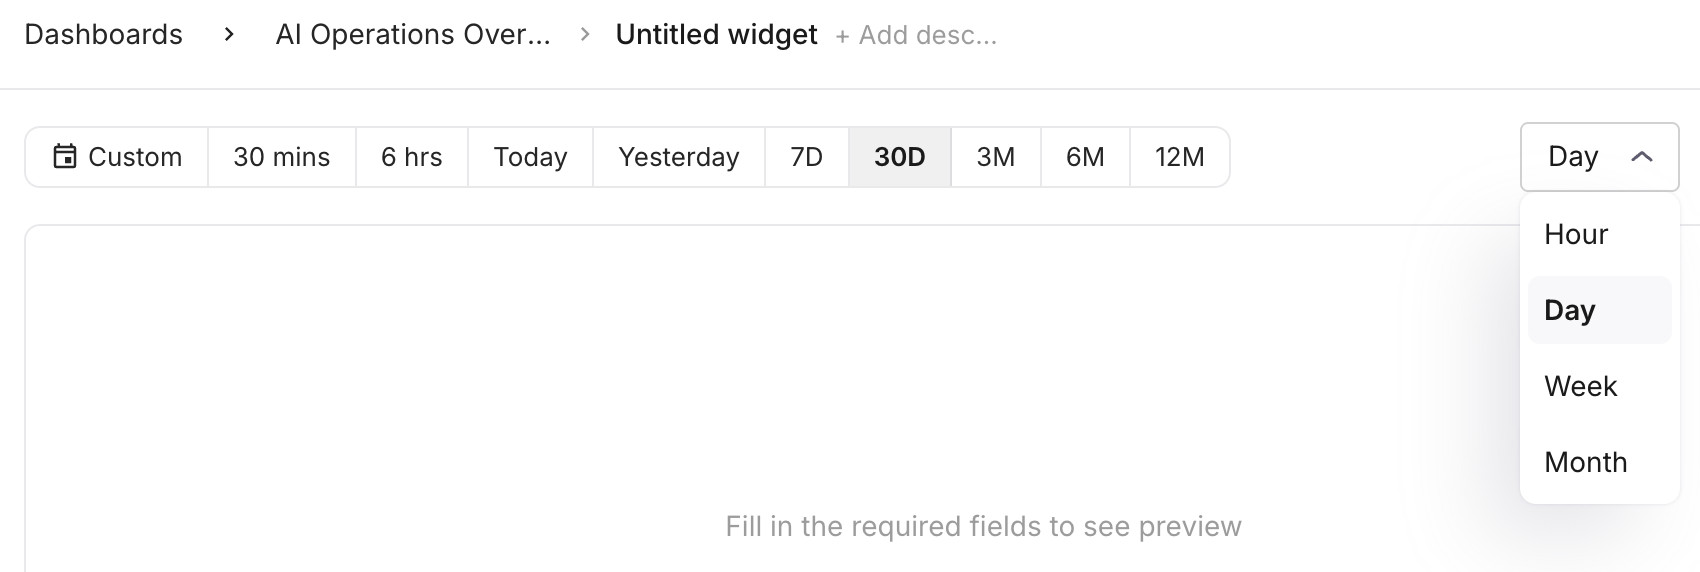
- Granularity: minute, hour, day, week, or month (options adjust based on the time range).
- Filters: narrow the query to specific spans.
- Group by: break down the metric by a span attribute (e.g. model, user, status).
Preview the result before saving.
Set the time range
Choose a global time range that applies to all widgets on the dashboard:
- Presets: 30 mins, 6 hrs, Today, Yesterday, 7D, 30D, 3M, 6M, 12M.
- Custom: pick a specific start and end date.
Arrange widgets
Resize and reorder widgets to build your layout:
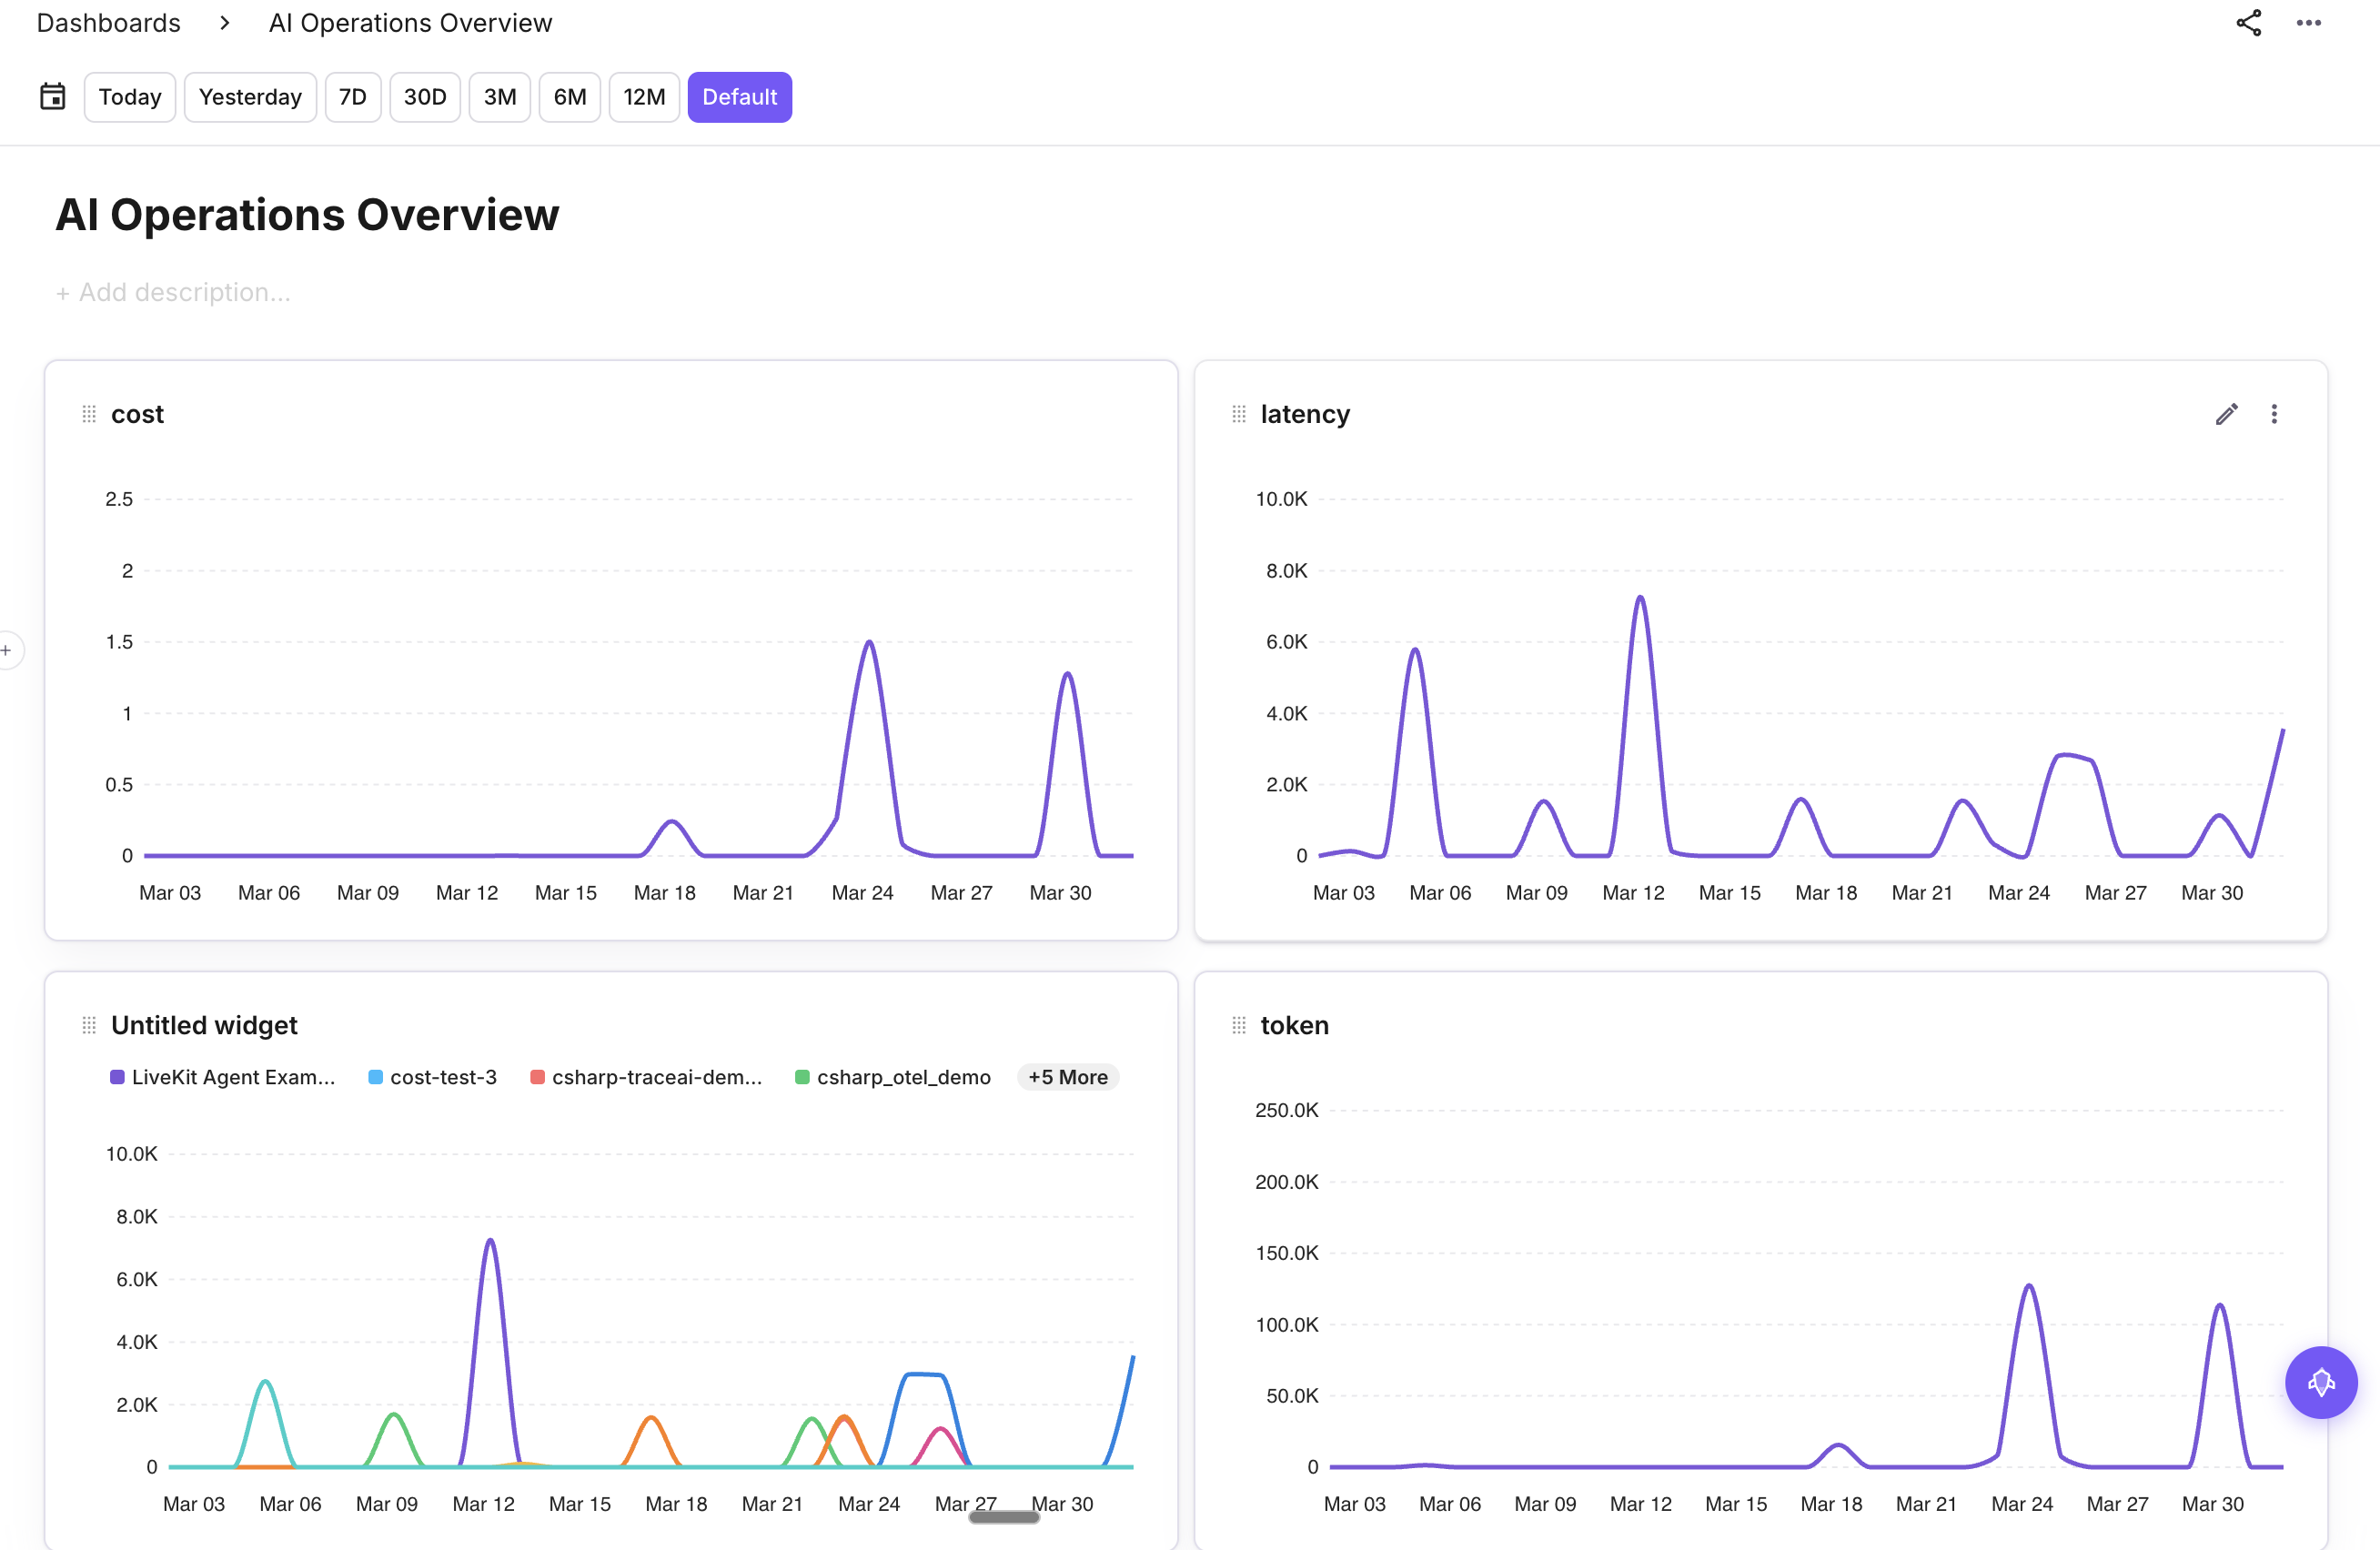 Drag and drop to reorder.
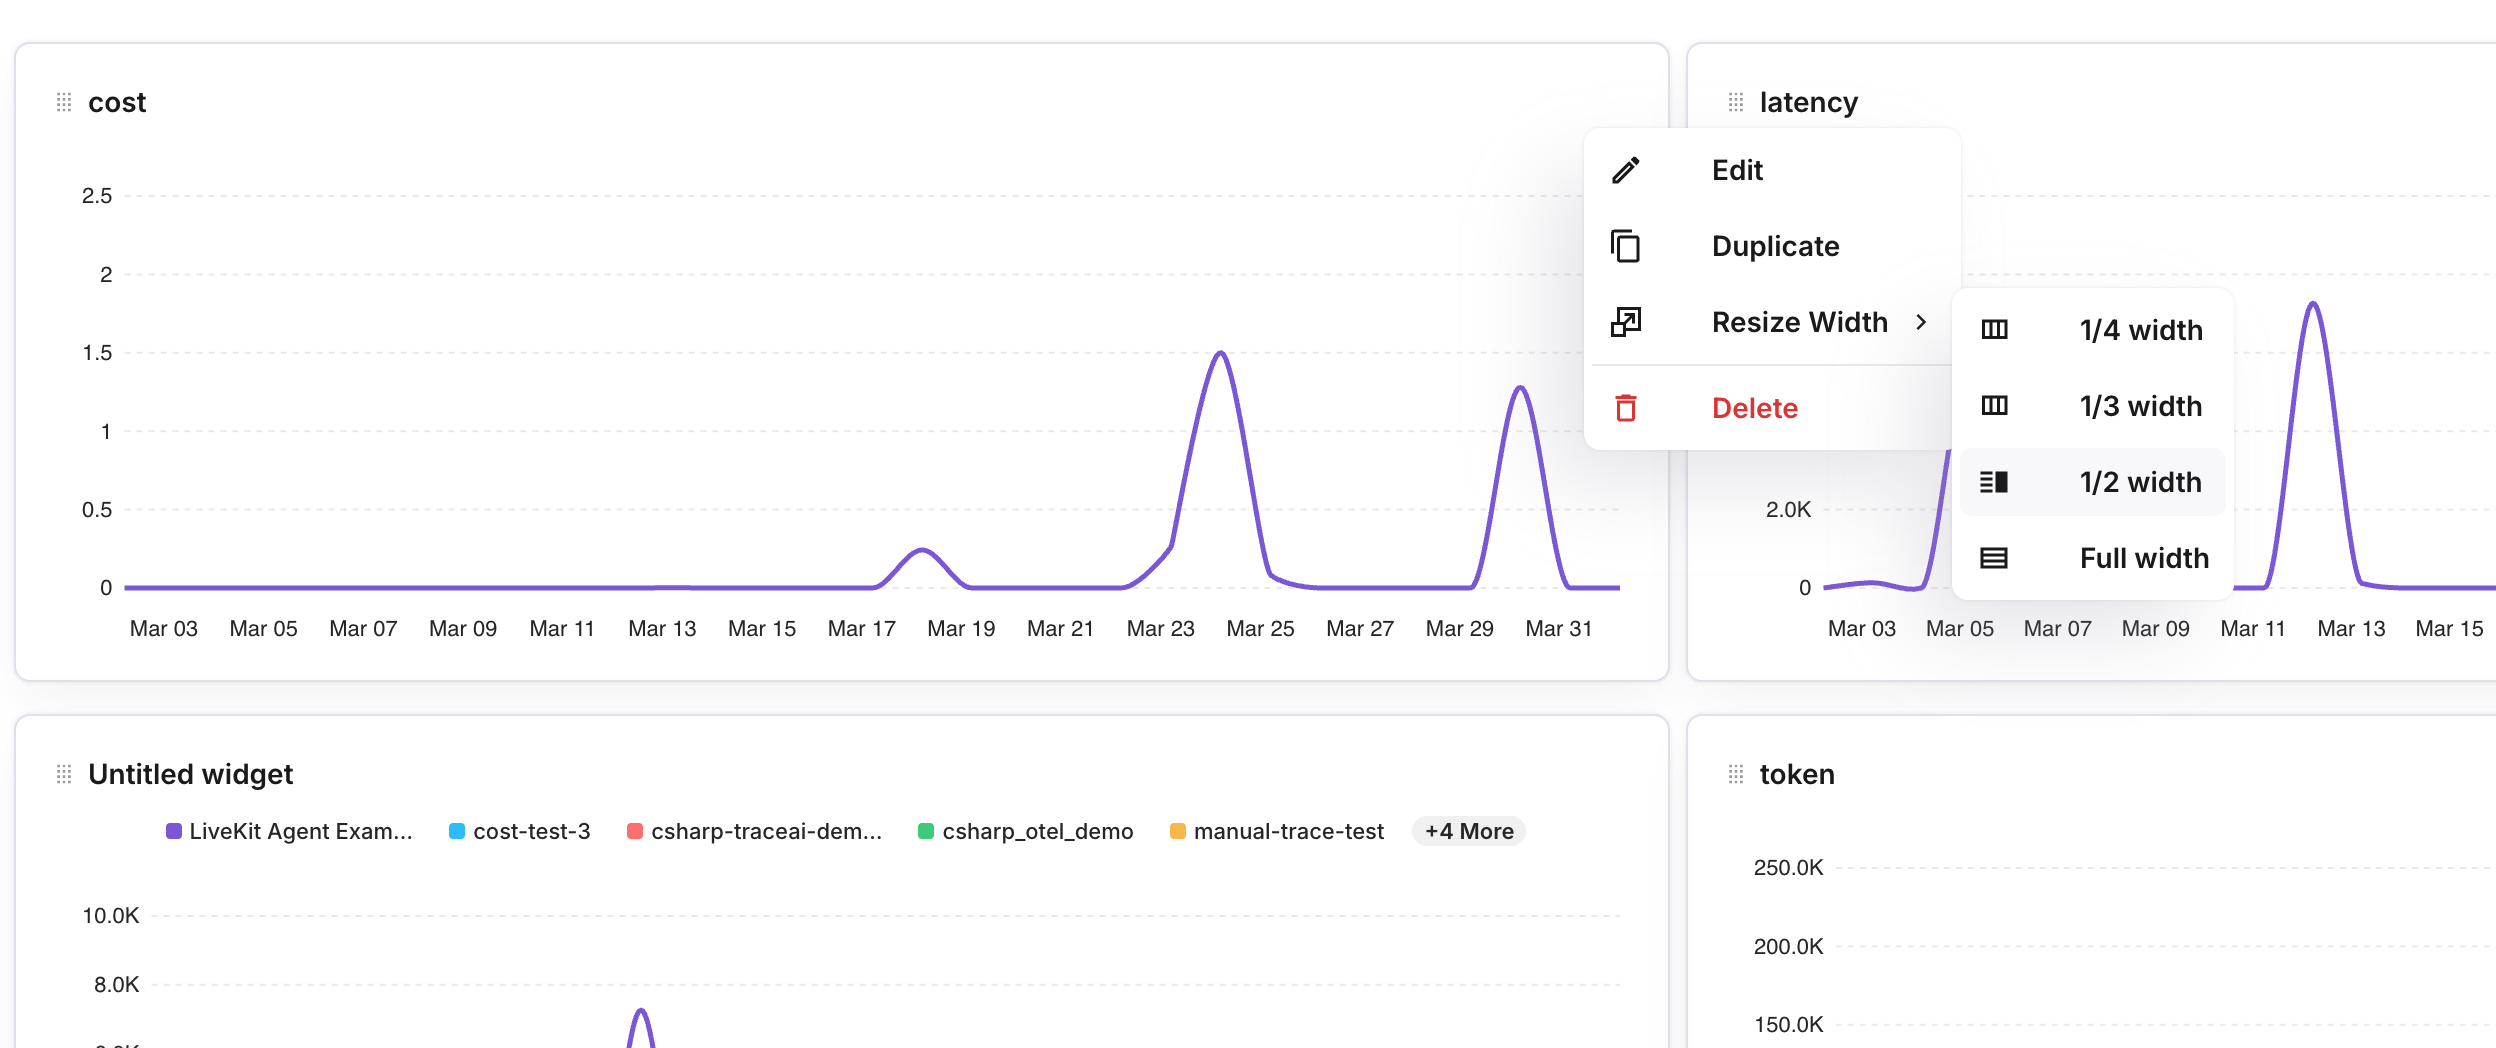
Manage widgets
Use the menu on each widget to edit, duplicate, resize, or delete it.
Note
Dashboards are scoped to your organization and project. All team members with access to the project can view and edit dashboards.
Next Steps
Questions & Discussion