Setup alerts
Get told the moment a metric crosses a threshold, so you catch a regression before your customers do.
Alerts watch a metric on your traces and notify you when it crosses a threshold you set, so a latency spike, an error surge, or a failing eval reaches you by email or Slack instead of sitting unnoticed. This guide sets up a span-latency alert on the support-agent project from the Observing a LangGraph agent cookbook.
Open the alert builder
Go to Alerts in the sidebar. The landing page lays out the three parts of every alert: the metric to watch, the conditions that trip it, and where the notification goes. Click Start creating alerts to begin, or New Alert at the top right once you already have some.
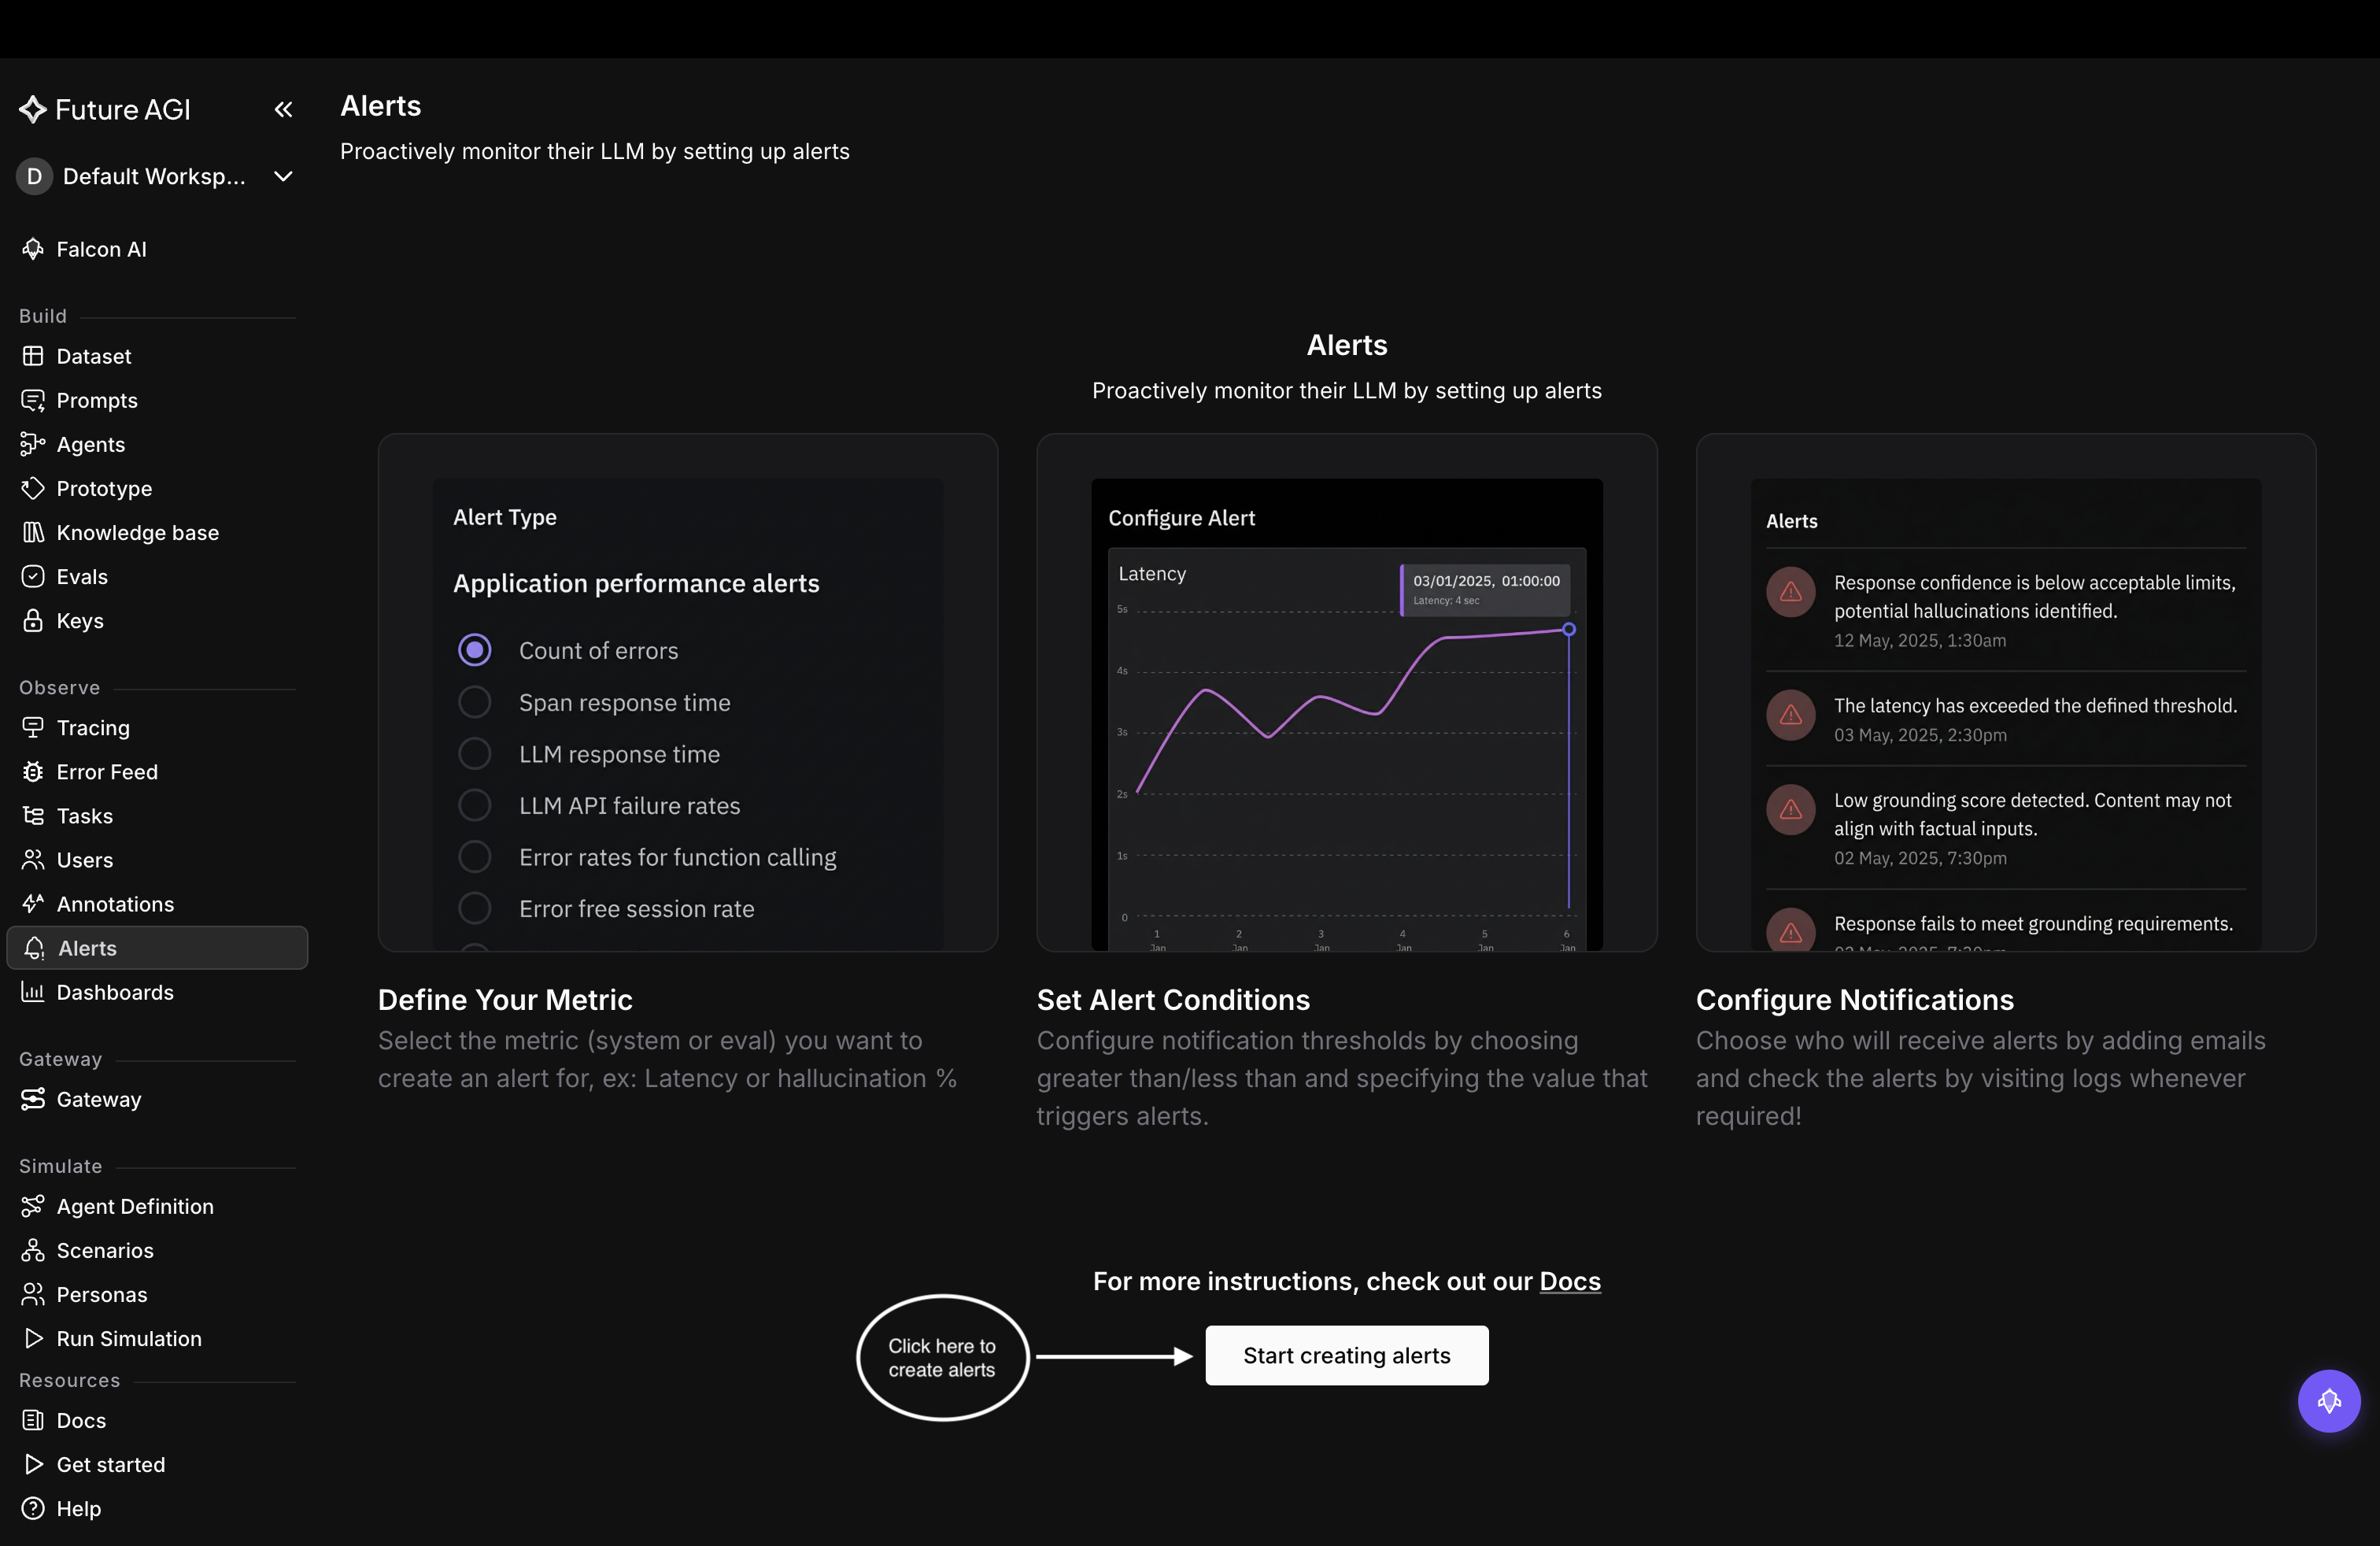
Open the builder from Start creating alerts on the Alerts page
Choose the project
An alert is scoped to one project. In Choose a project, select support-agent and click Next.
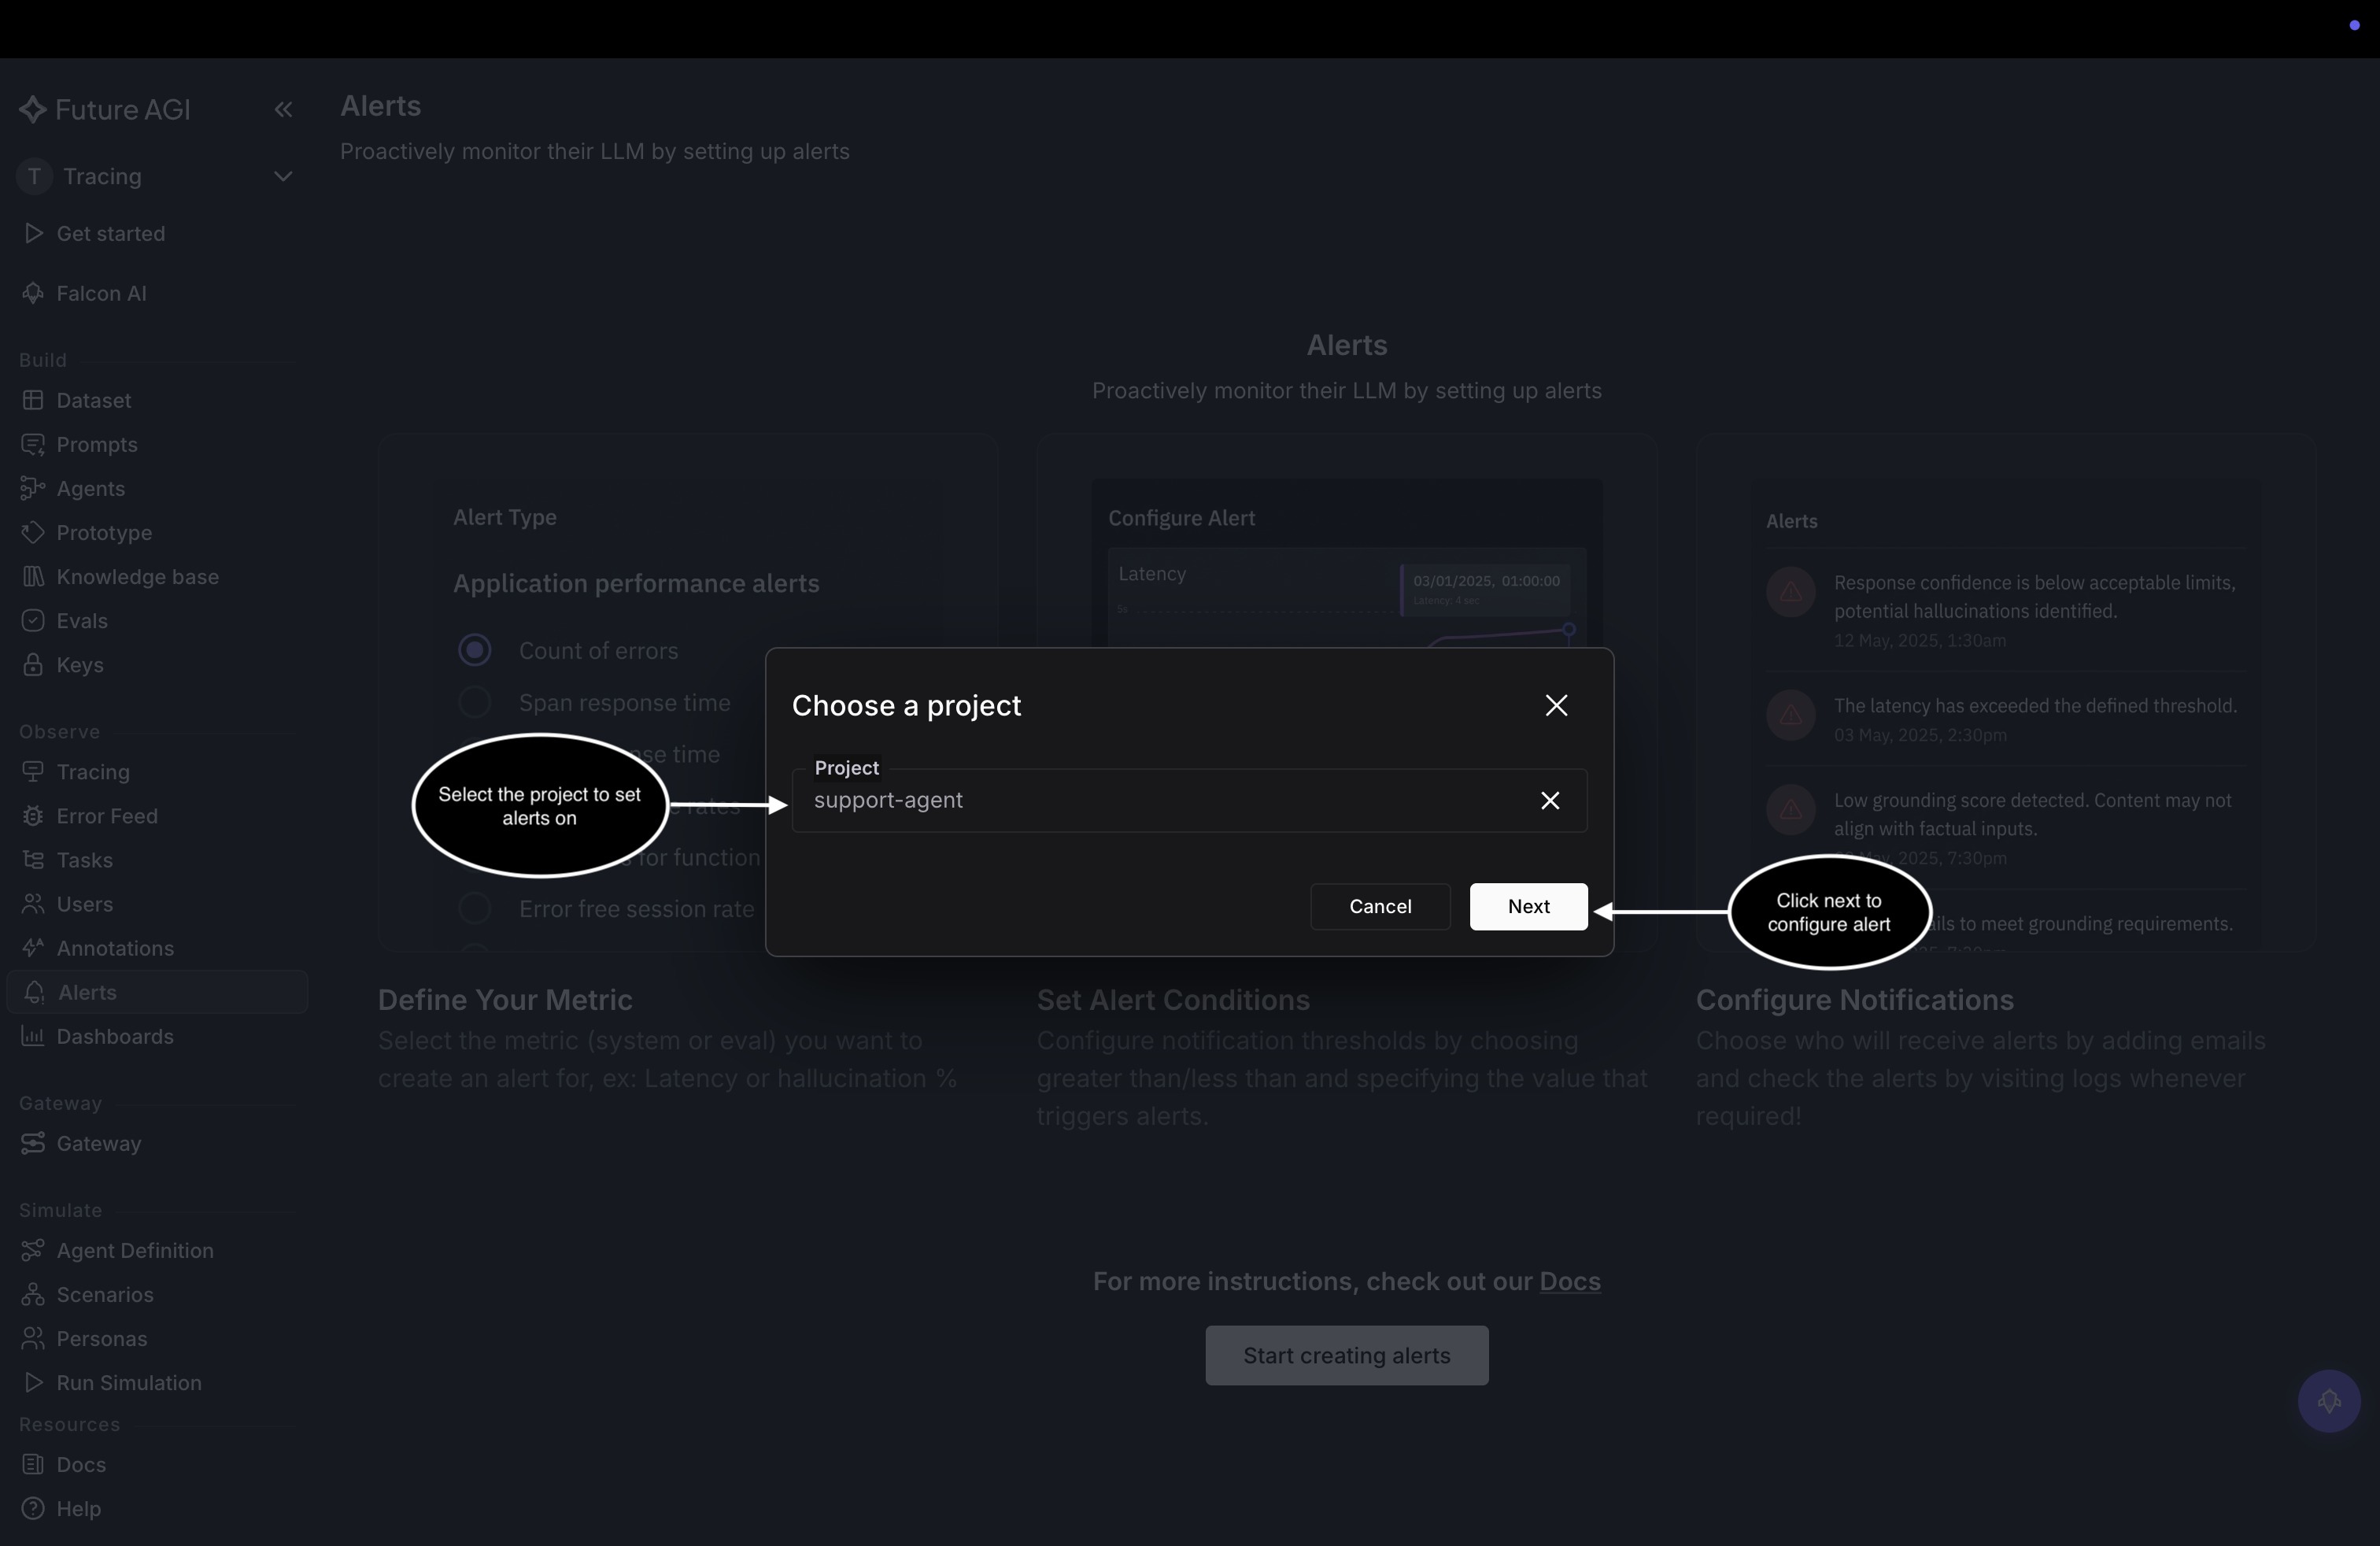
Pick the project the alert watches, here support-agent, then Next
Pick the metric to watch
The builder opens on Select Alert Type. Metrics come in two groups: Application performance alerts (count of errors, span response time, LLM response time, API failure rates, and more) and Metric alerts (evaluation metrics, token usage, daily and monthly spend). Choose the one you want to hear about and click Next. This example watches Span response time, the latency of individual spans. To alert on a failing eval instead, pick Evaluation Metrics and point it at a score like groundedness.
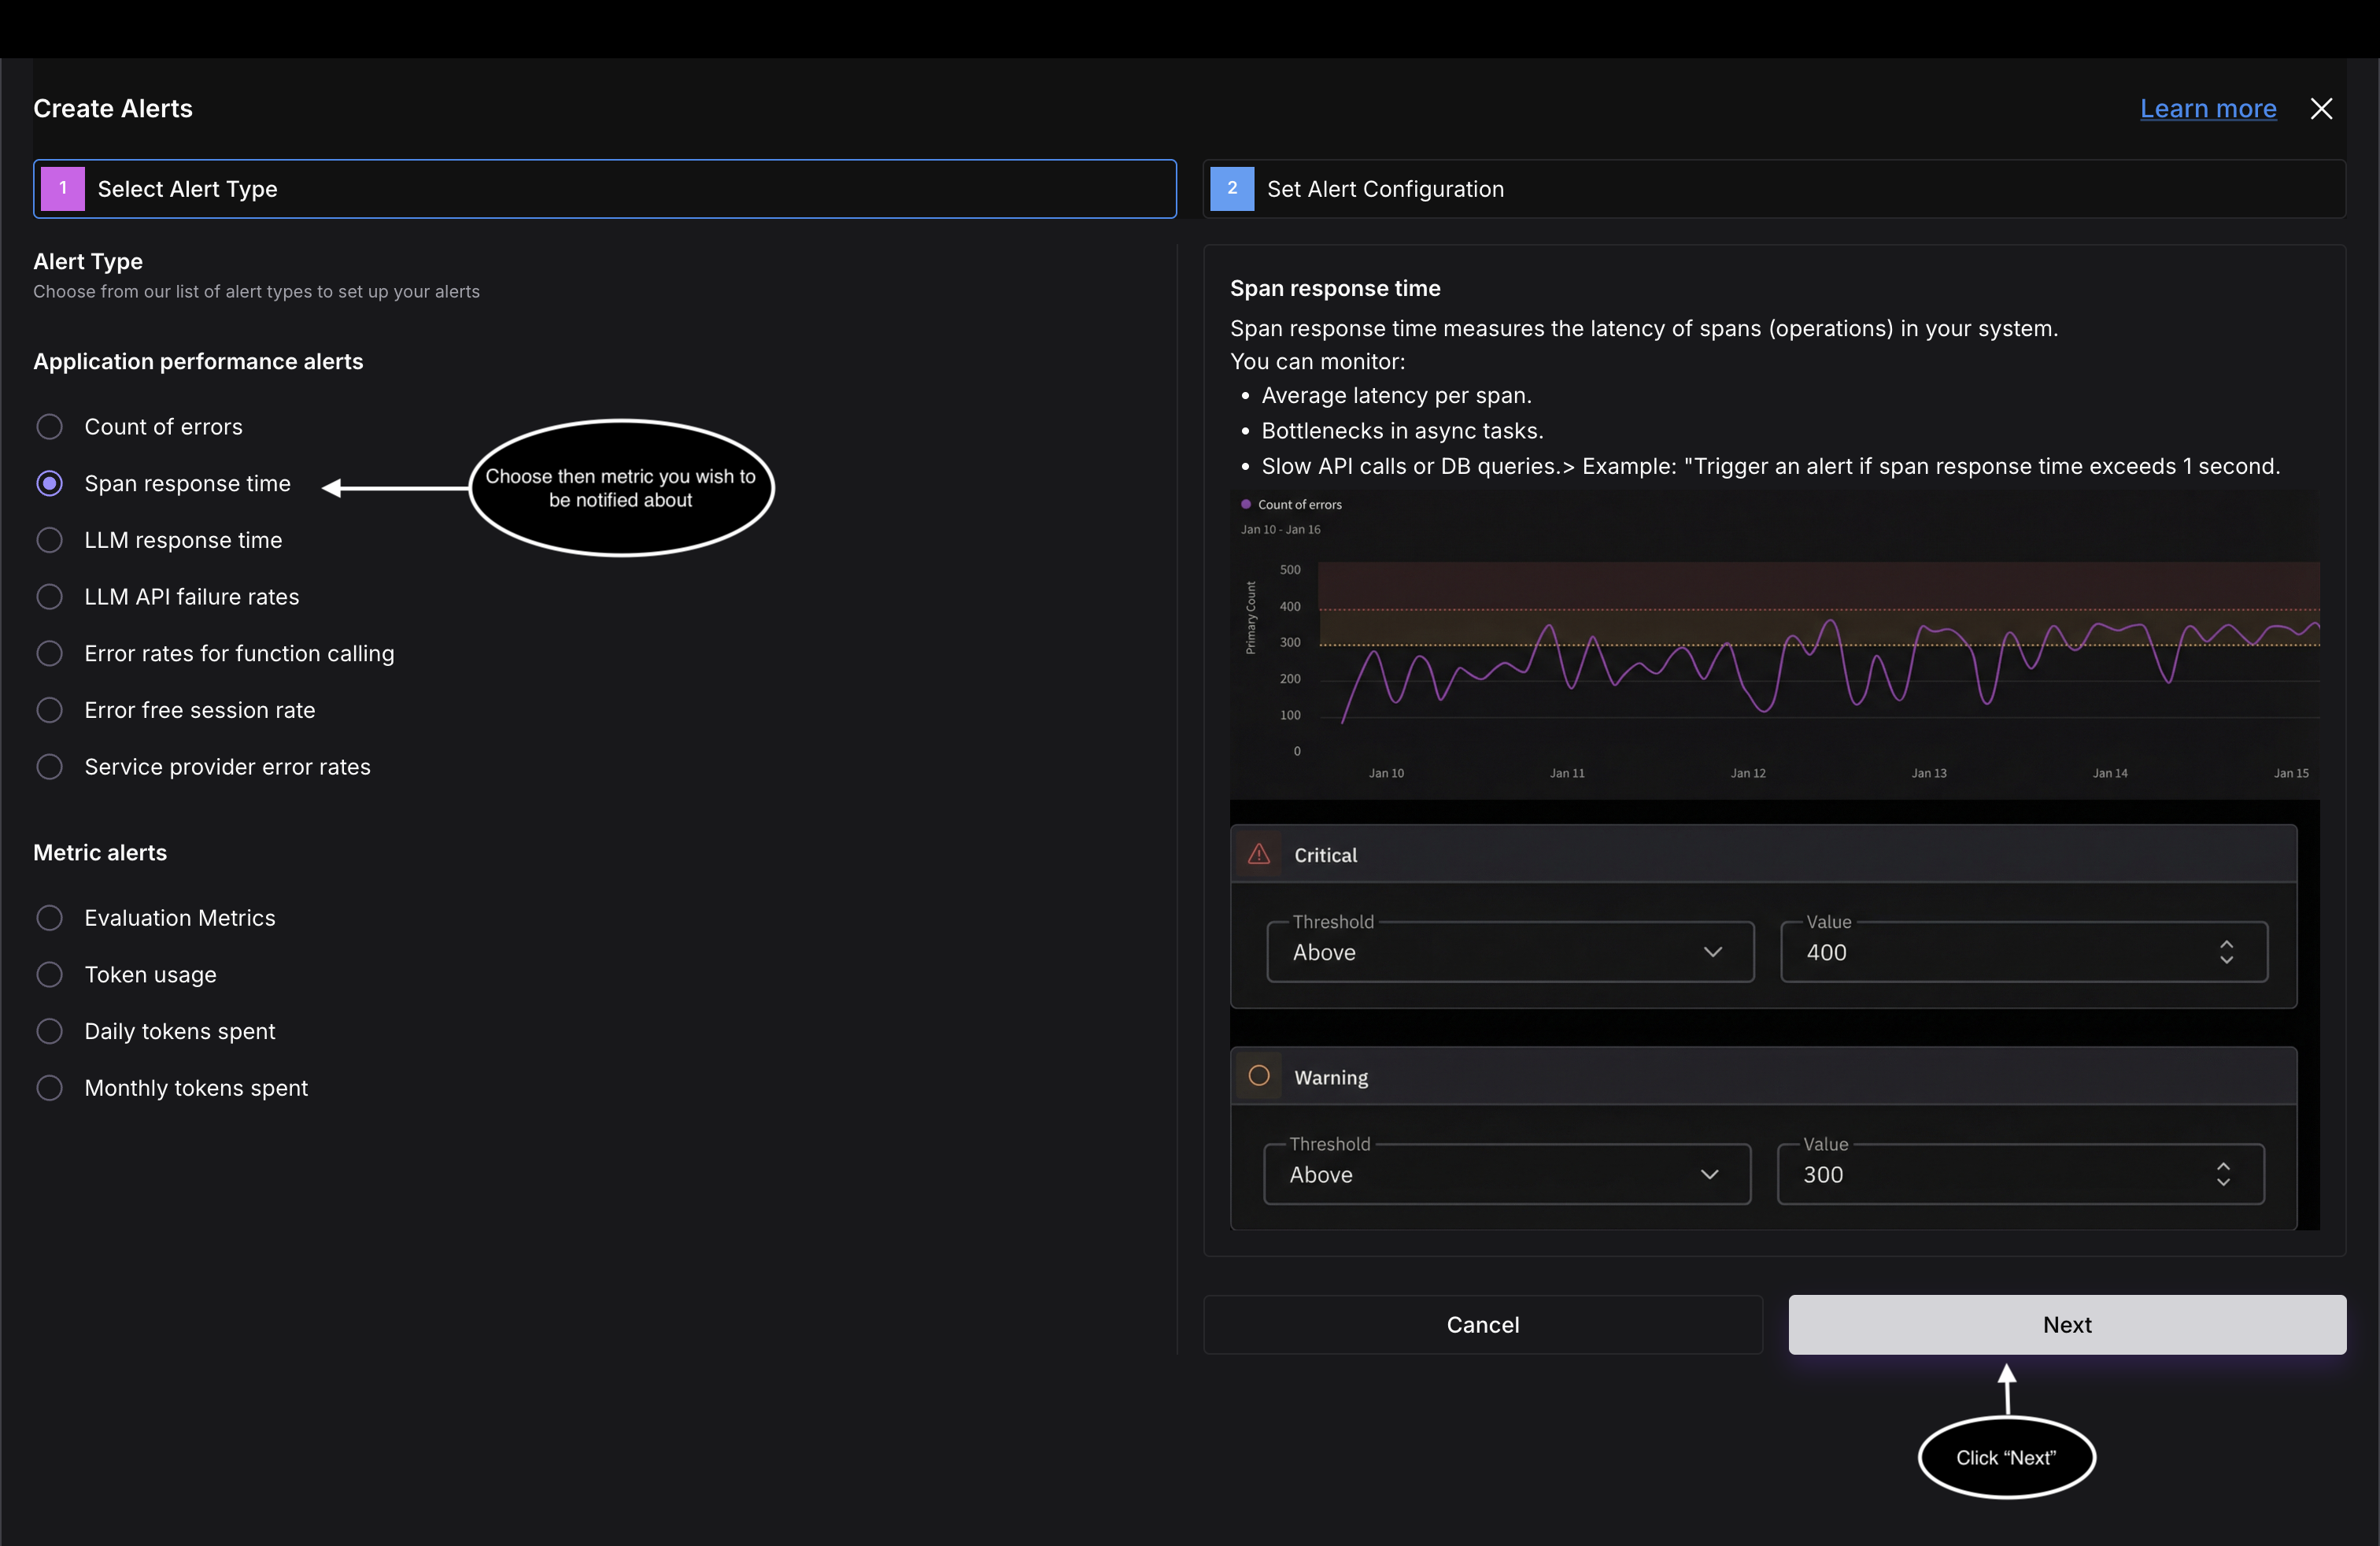
Choose the metric to alert on; this example uses Span response time
Name it, set the metric and interval, and filter
Step 2, Set Alert Configuration, is where the alert takes shape. Give it a clear Name (Slow span time here). Under Define Metrics & Interval, confirm the Metric and set the Interval it is evaluated over, so a 5-minute interval recomputes the value every 5 minutes. Under Filter Events, narrow the alert to the spans that matter, for example Span Type is LLM so only model-call latency counts. The time selector at the top reframes the chart while you tune.
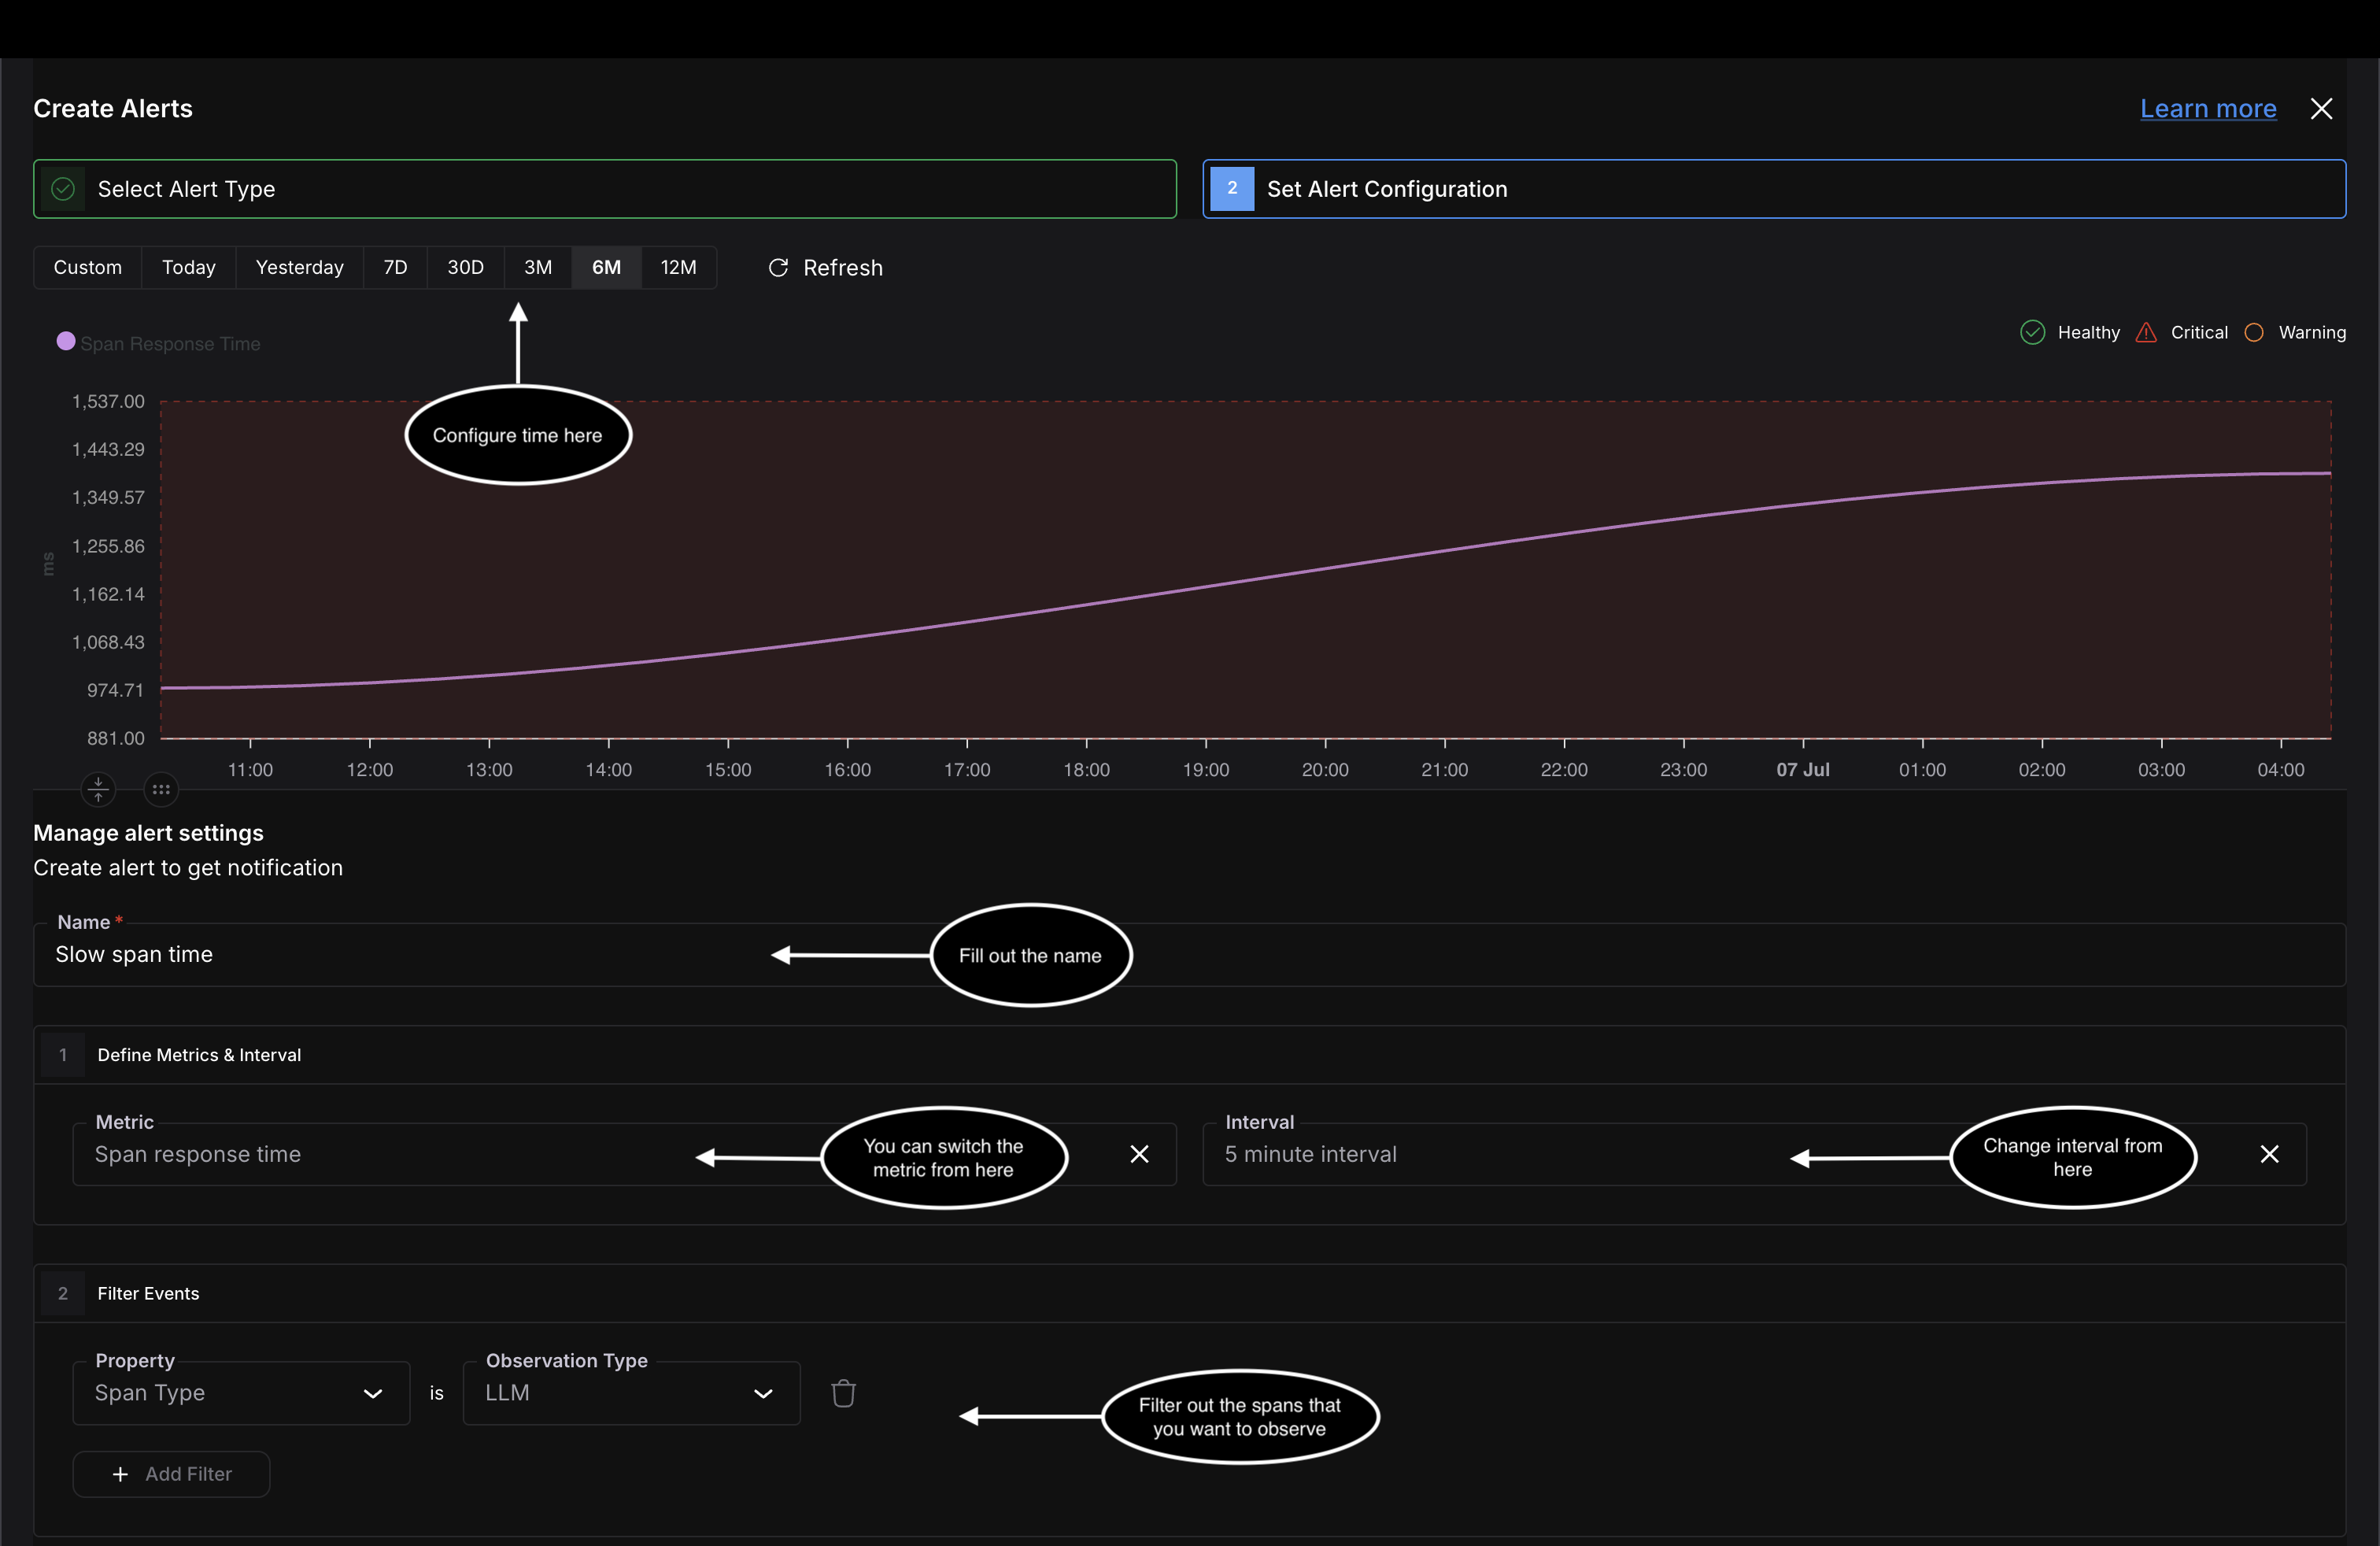
Name the alert, set its metric and interval, and filter to the spans you care about
Set the thresholds and where it goes
Under Define Alert, choose how the threshold is read: a Static Value (above or below a fixed number) or a Percentage Change against the previous period. Then set two levels, Critical and Warning, each with a direction (Above or Below) and a value, so a bad spike escalates differently from an early warning. Here Critical is above 200 ms and Warning above 100 ms. Under Define Notification, choose Email or Slack, add the recipients, and click Create Alert.
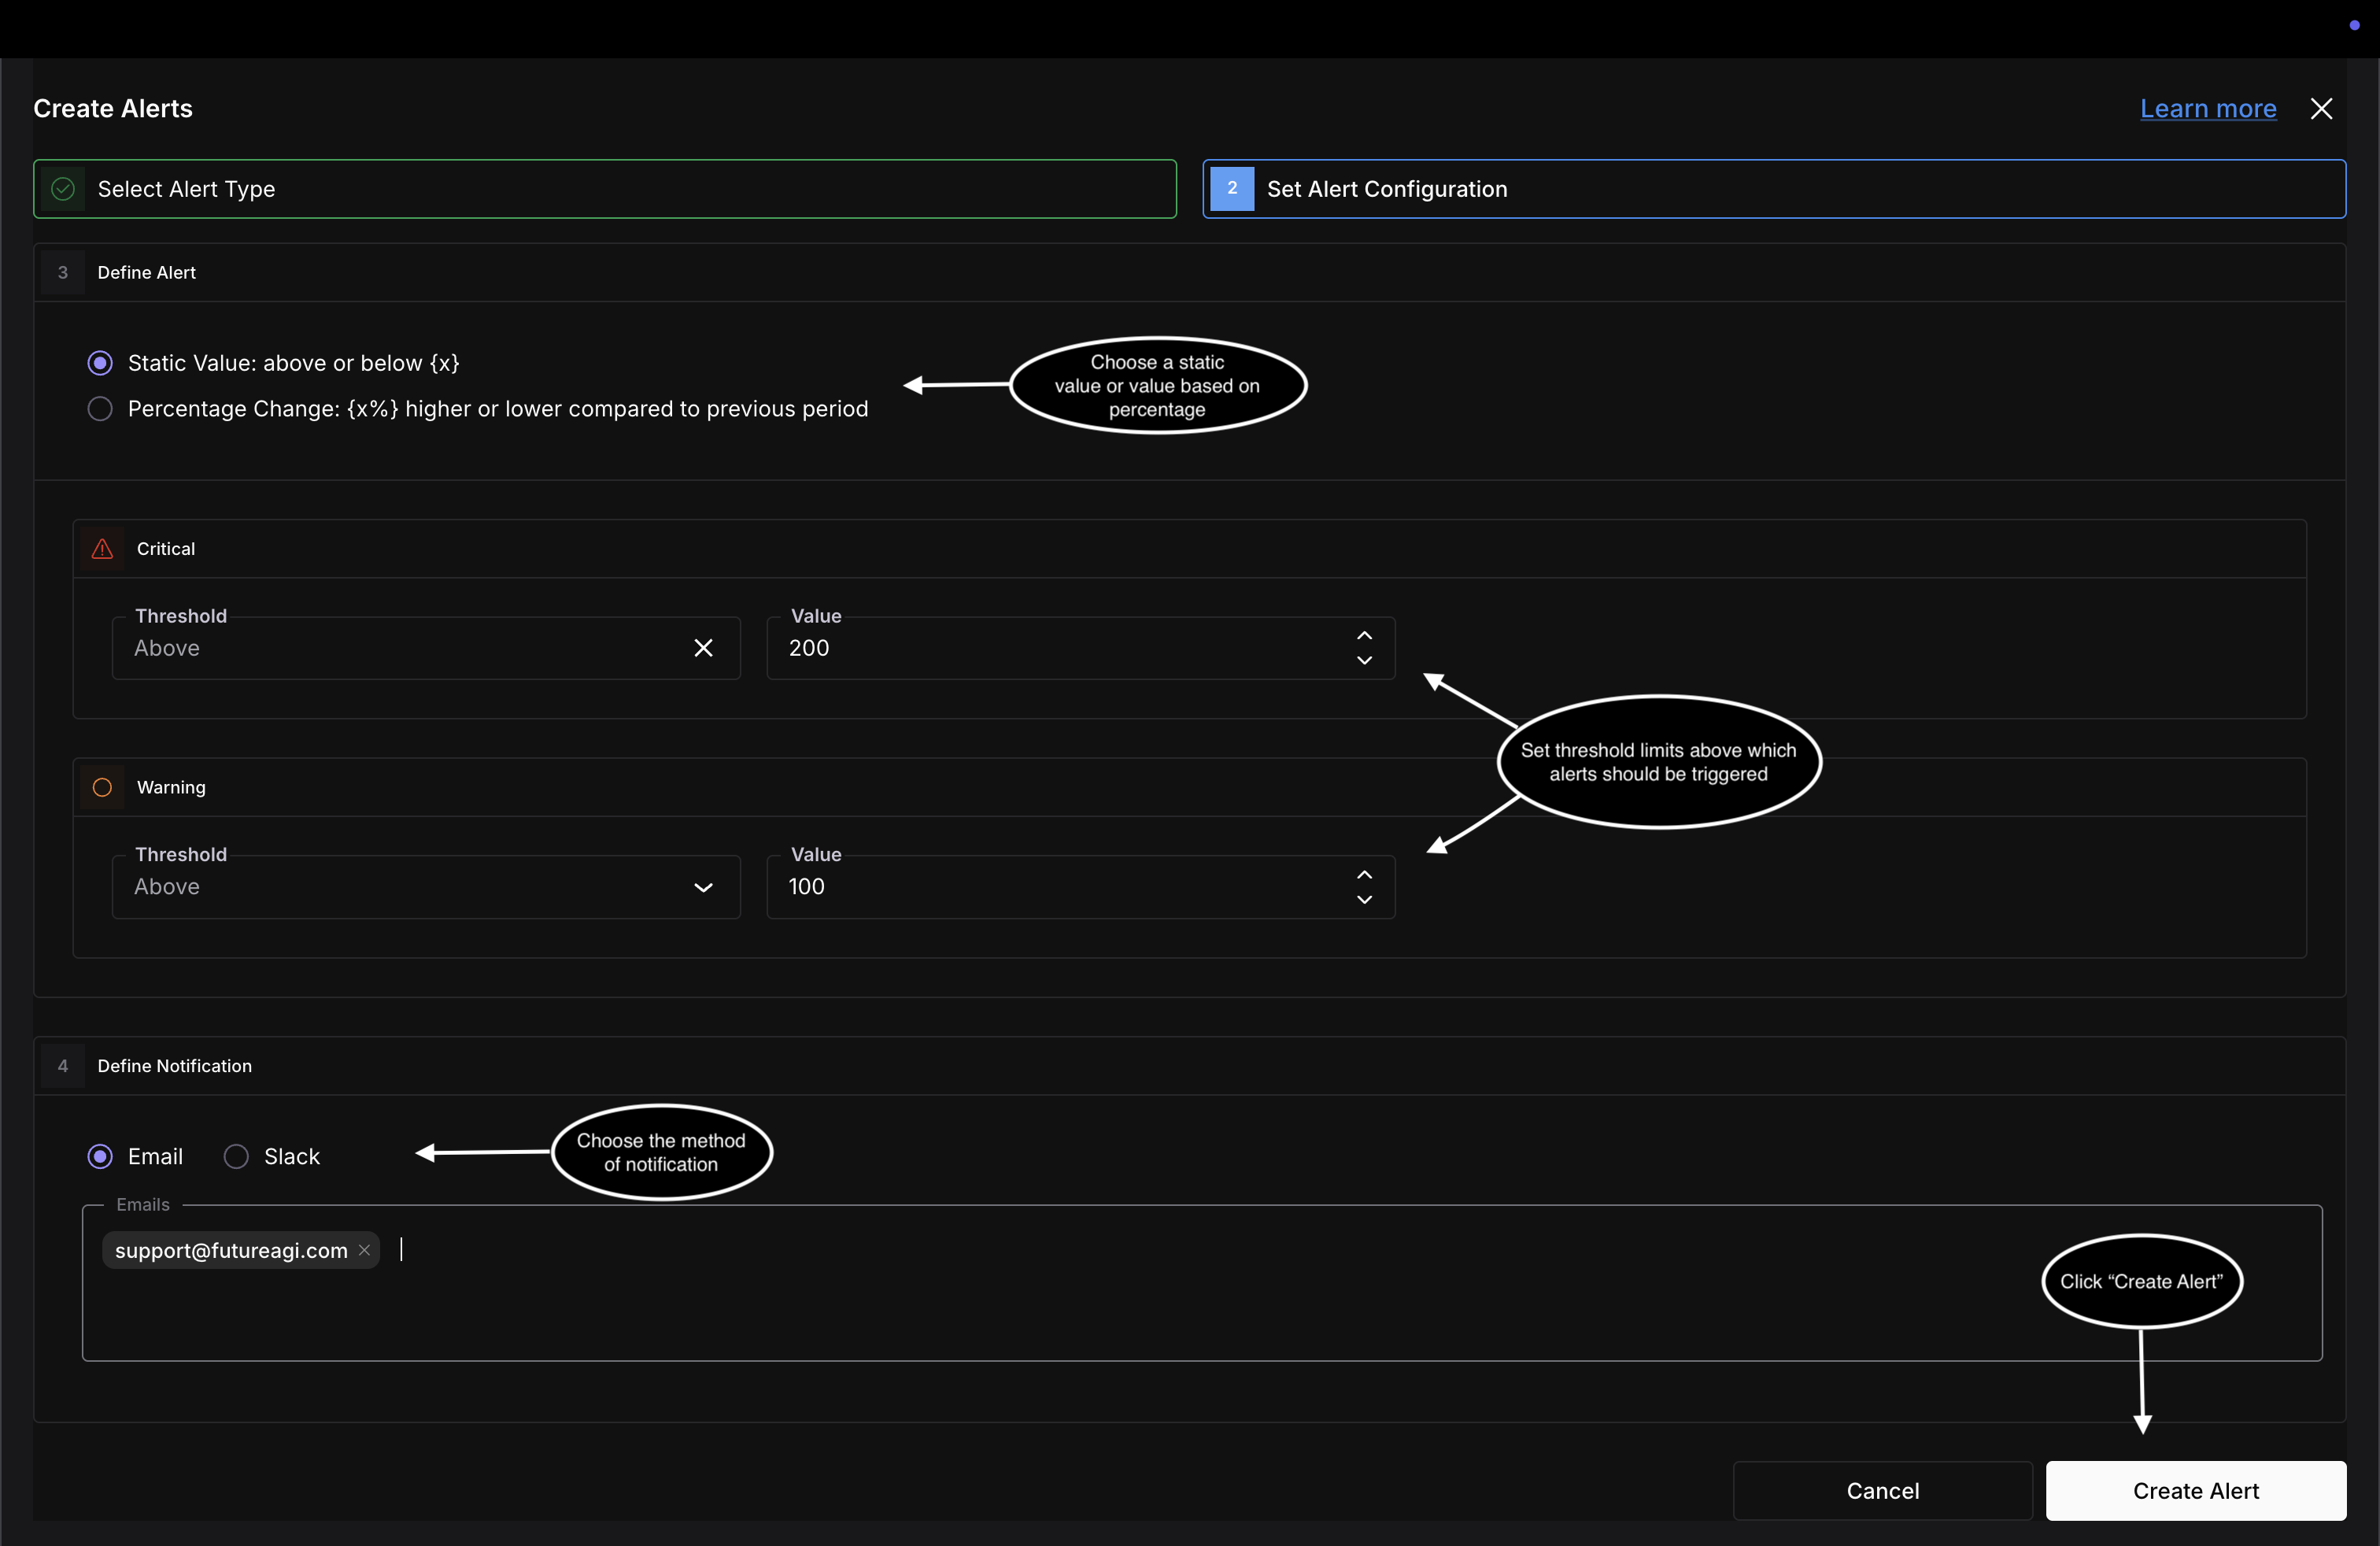
Set Critical and Warning thresholds, pick Email or Slack, then Create Alert
Confirm it’s live
The alert lands in the Alerts table with its Status, Alert Type, Last Triggered time, and trigger count. A fresh alert reads Healthy with no triggers yet; when the metric crosses a threshold it flips to Warning or Critical, stamps Last Triggered, and sends the notification. If an alert you expected never fires, work through Alerts did not fire.
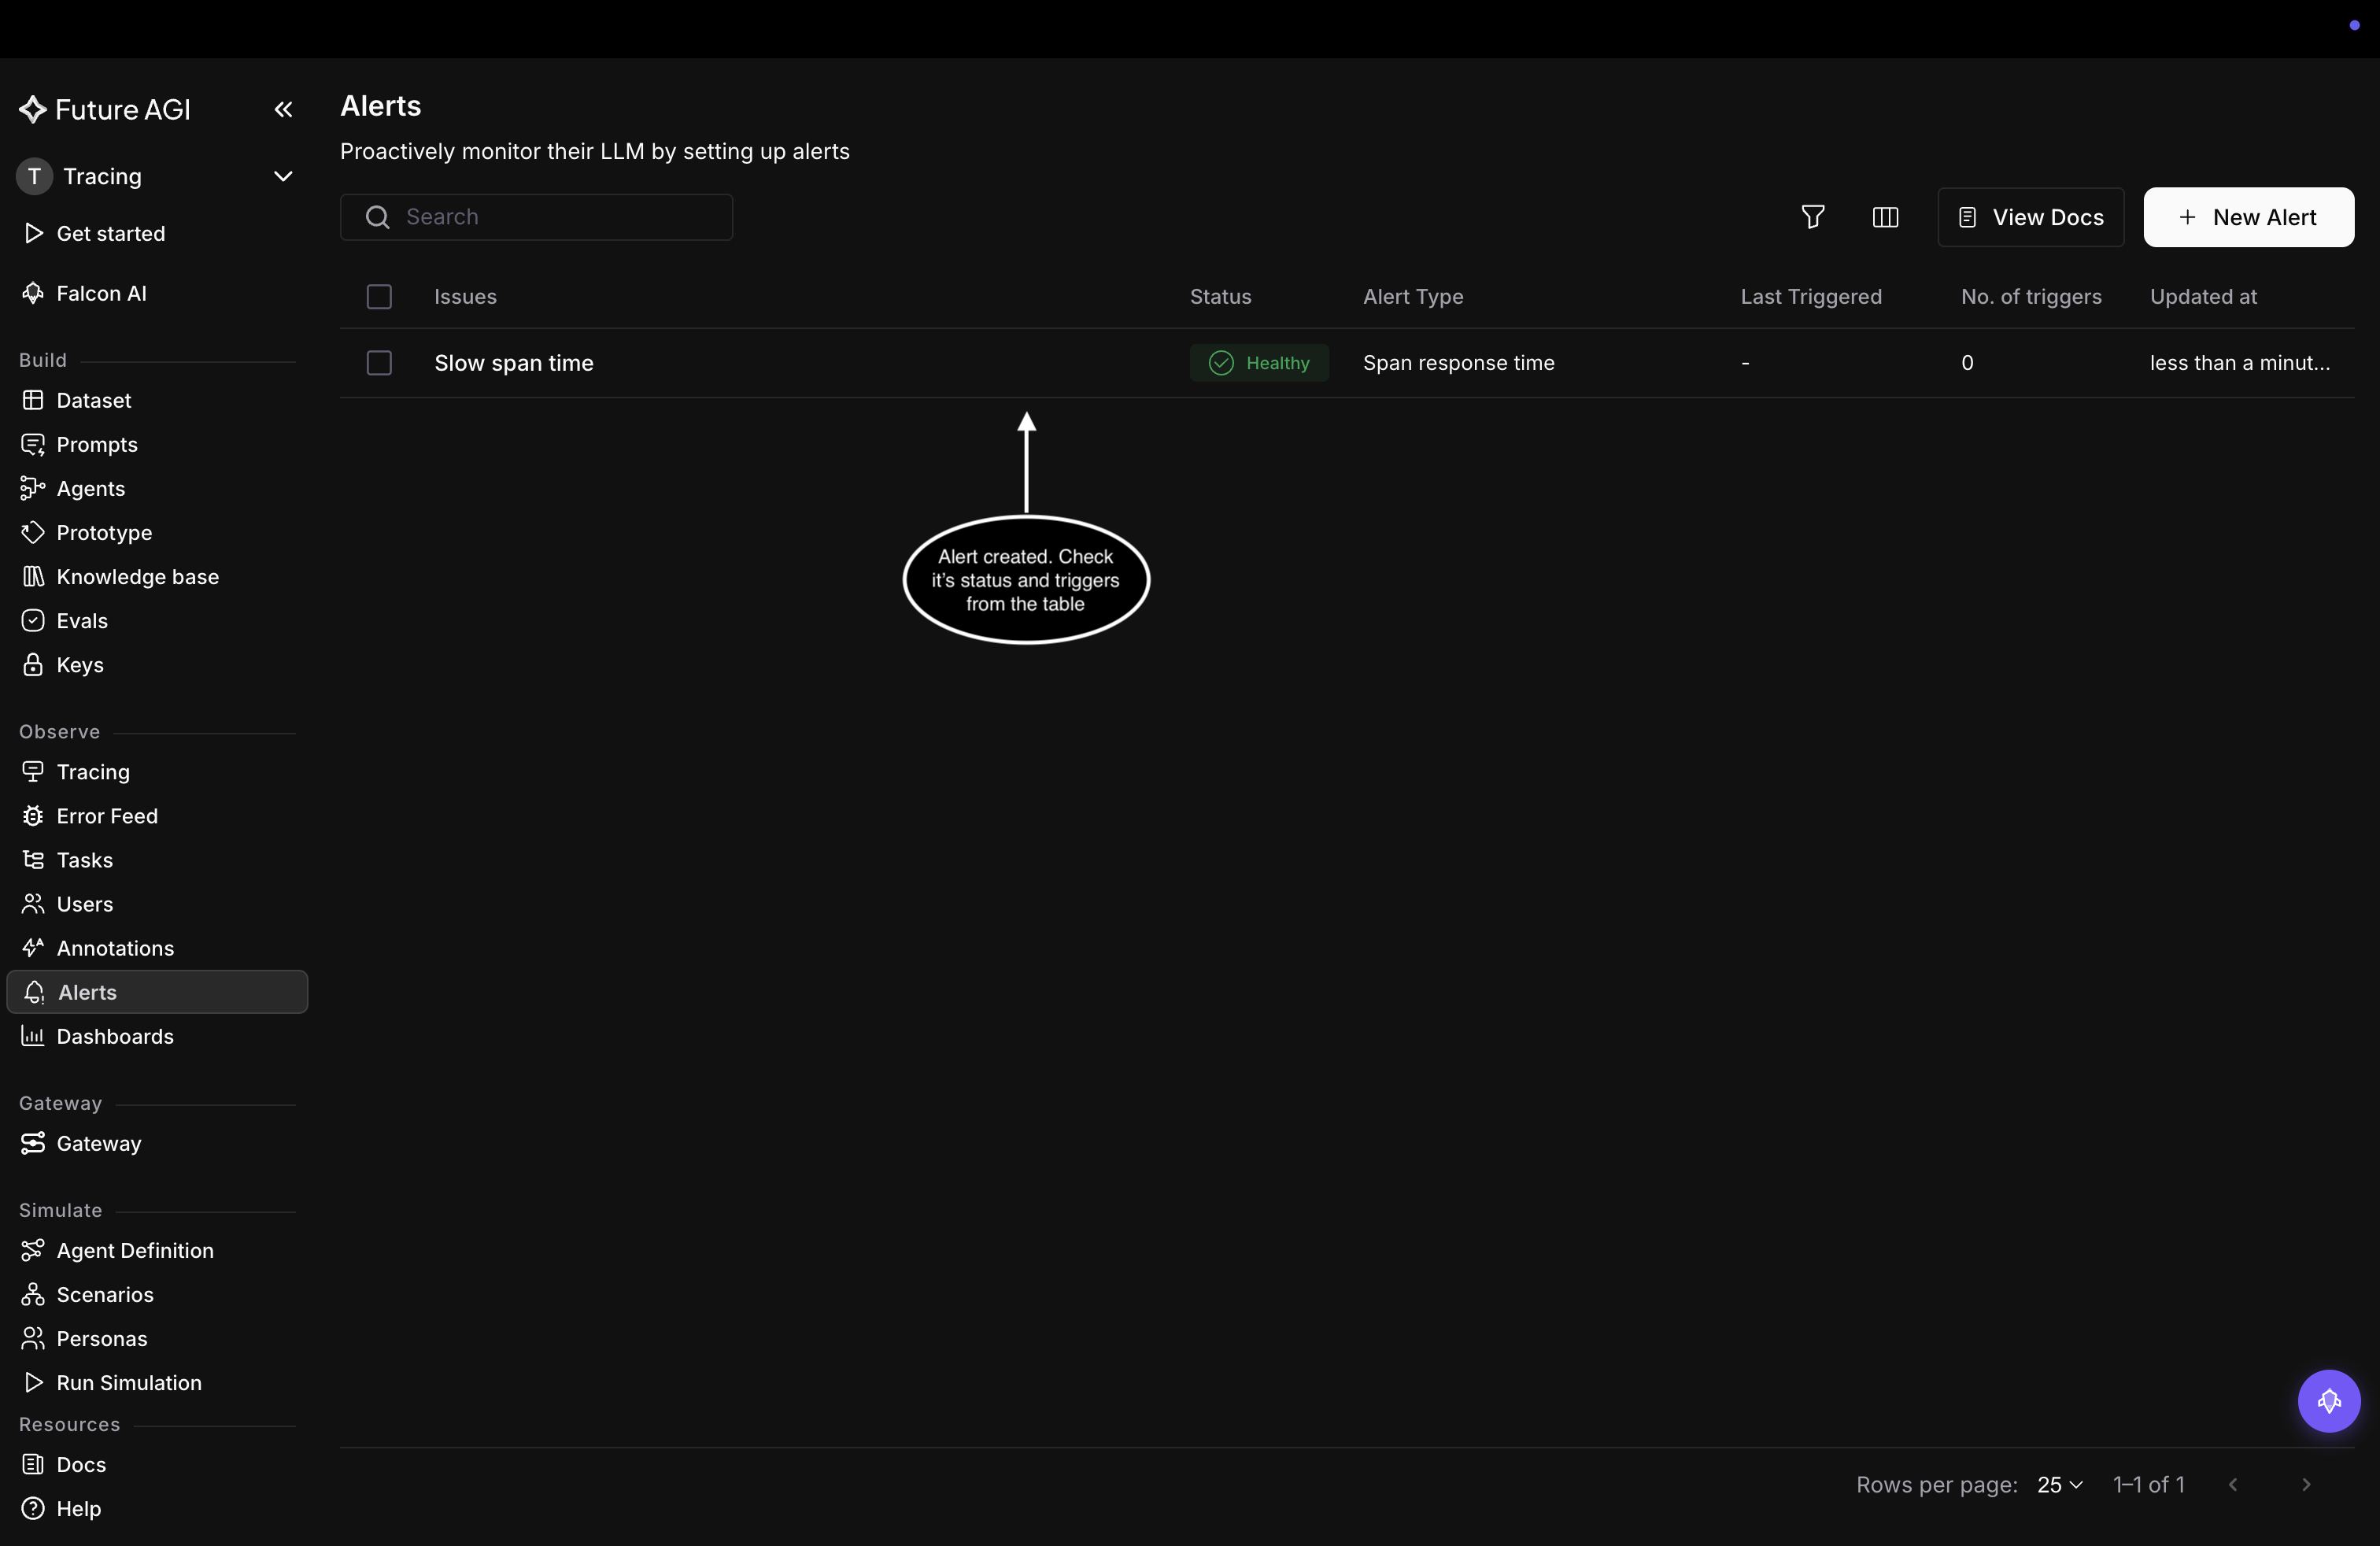
The new alert lands in the table, Healthy until a threshold is crossed
Questions & Discussion