Explore dashboard
Find your way around the Observe dashboard: projects, the trace table, and where each metric lives.
Once traces start flowing in, everything you do in Observe happens in the dashboard. This guide walks the layout using the support-agent project from the cookbook below, so you know where projects, traces, and metrics live before you dive into evals, alerts, and filters.
Note
Throughout these guides we follow one end-to-end example, the Observing a LangGraph agent and obtaining insights cookbook. It instruments a real app and exercises every Observe feature, so you can read a guide here and watch it applied start to finish there.
Open your project
- Every project you trace to lives under Observe → Tracing. Each project you trace to appears in Tracing; open one to see its traces.
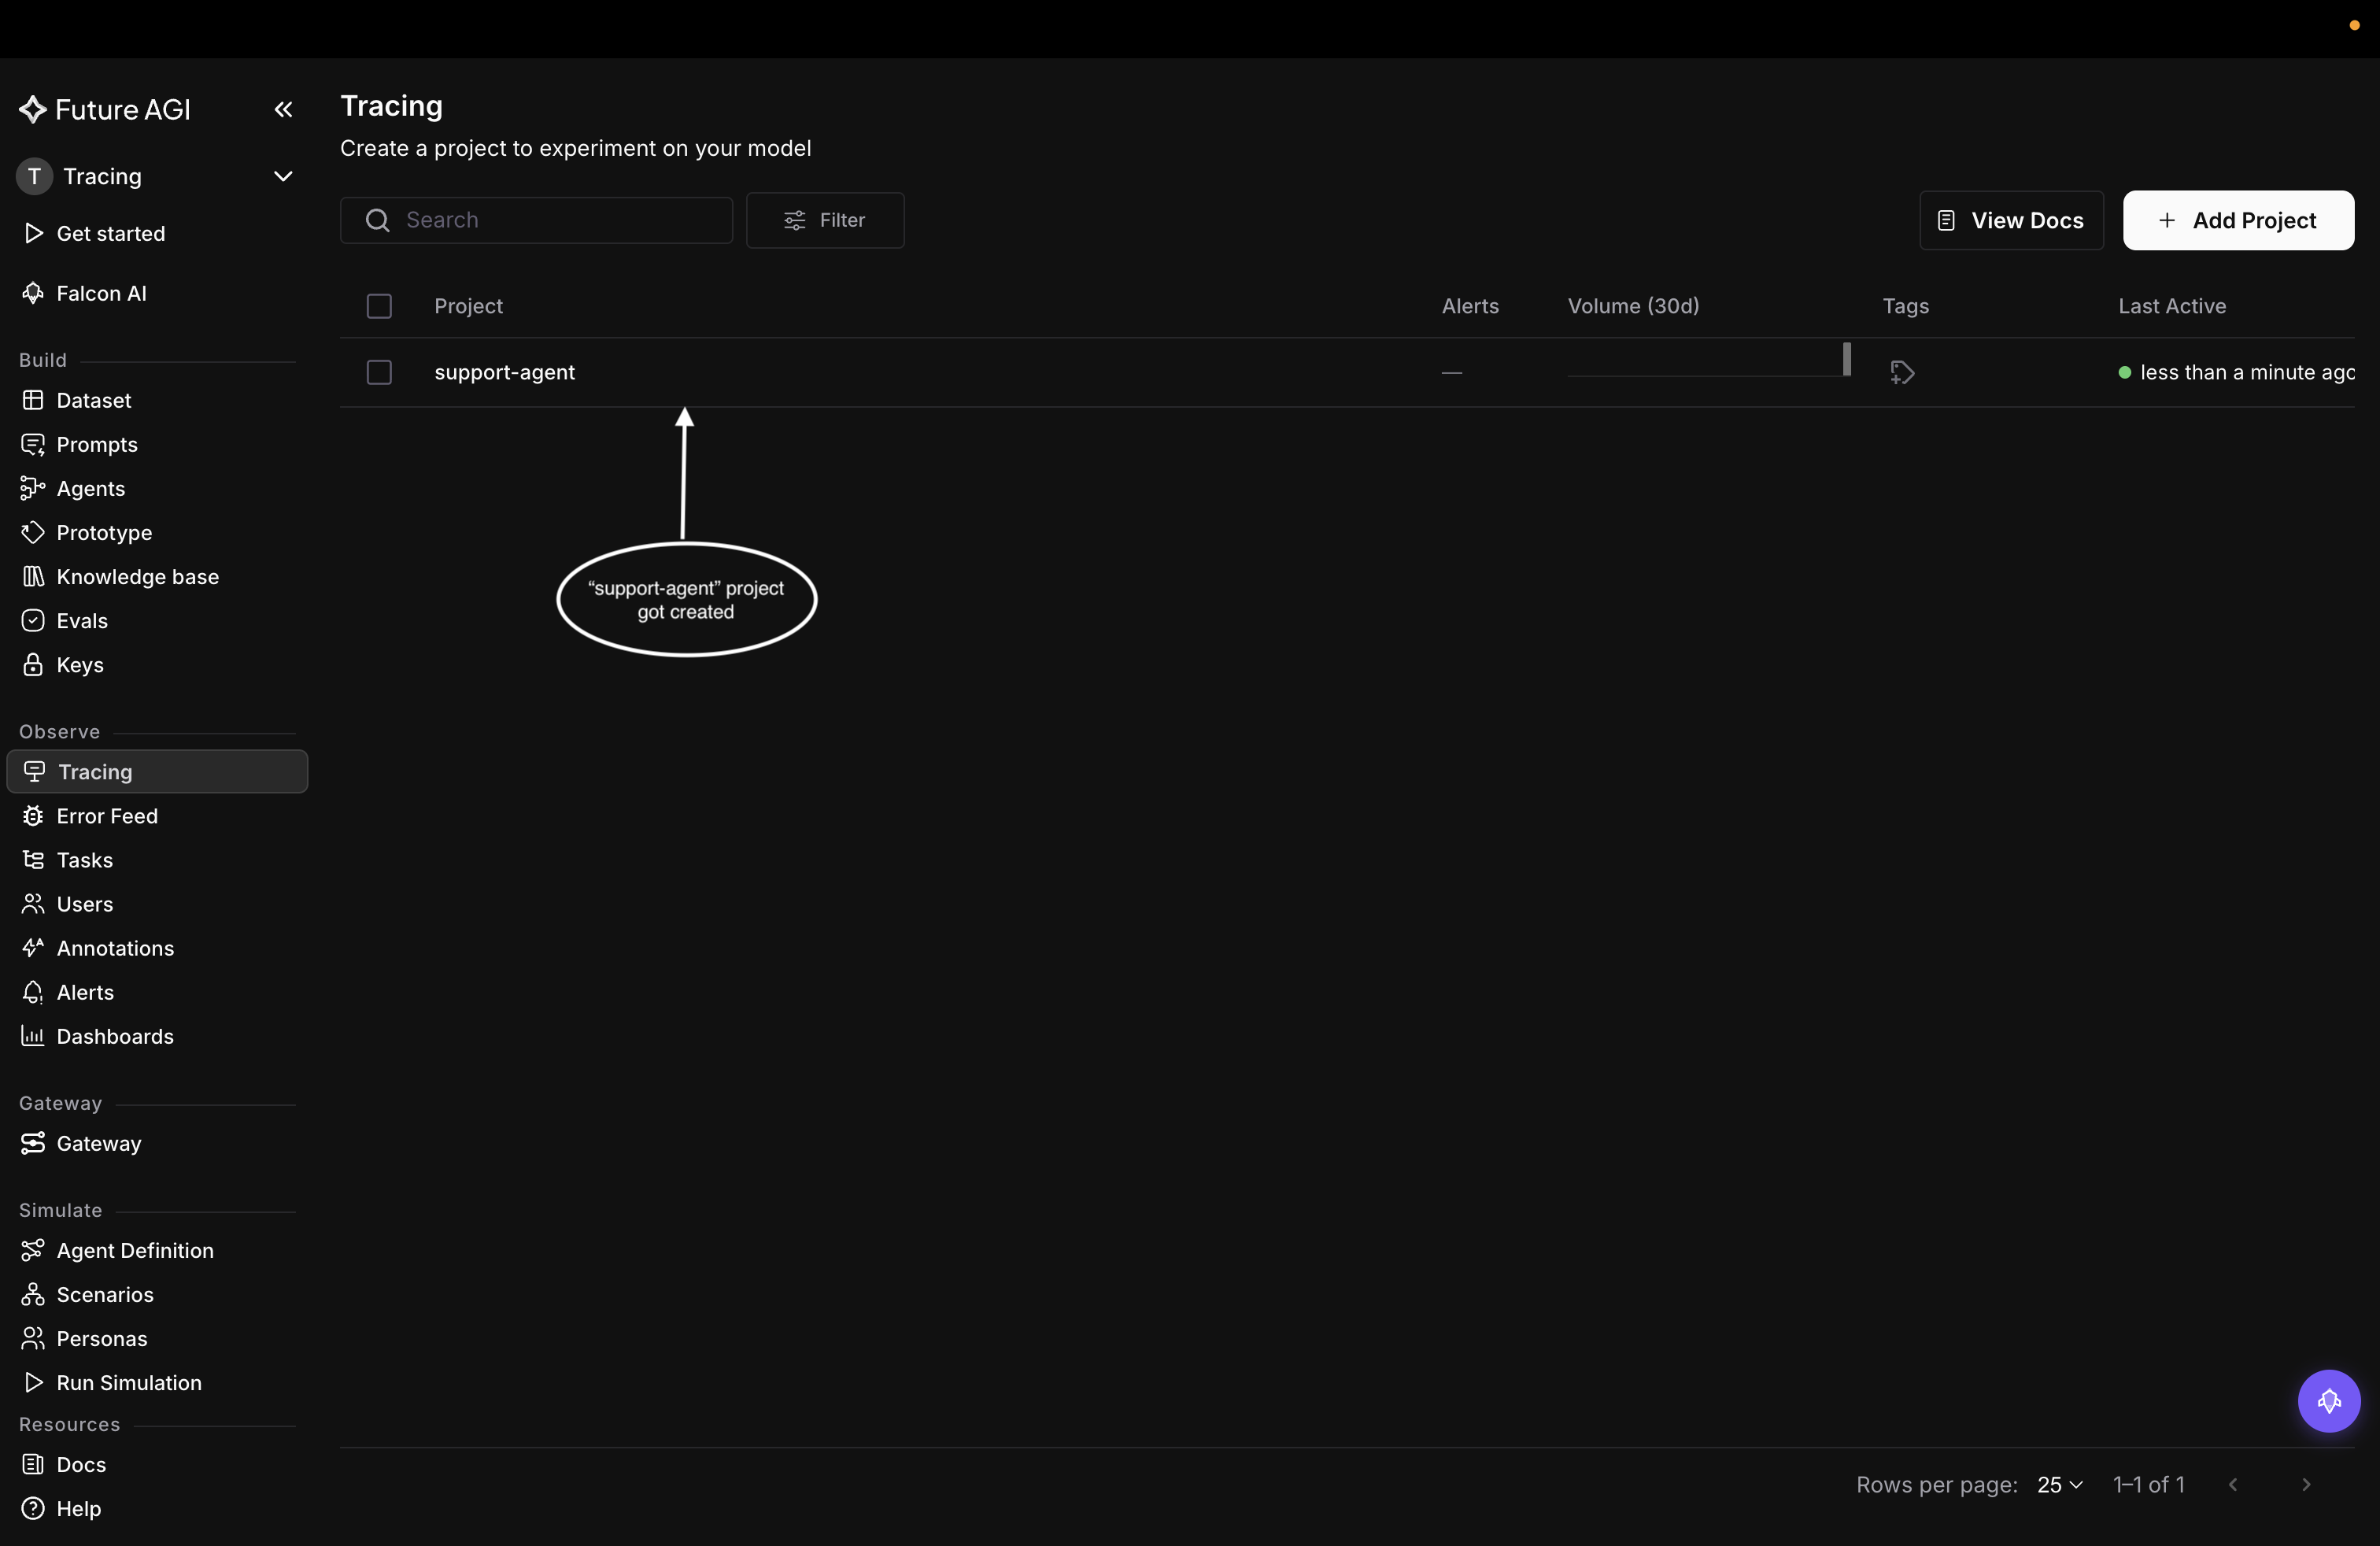
- Inside the project, traces land in the table as they arrive, starting with the first one you send.
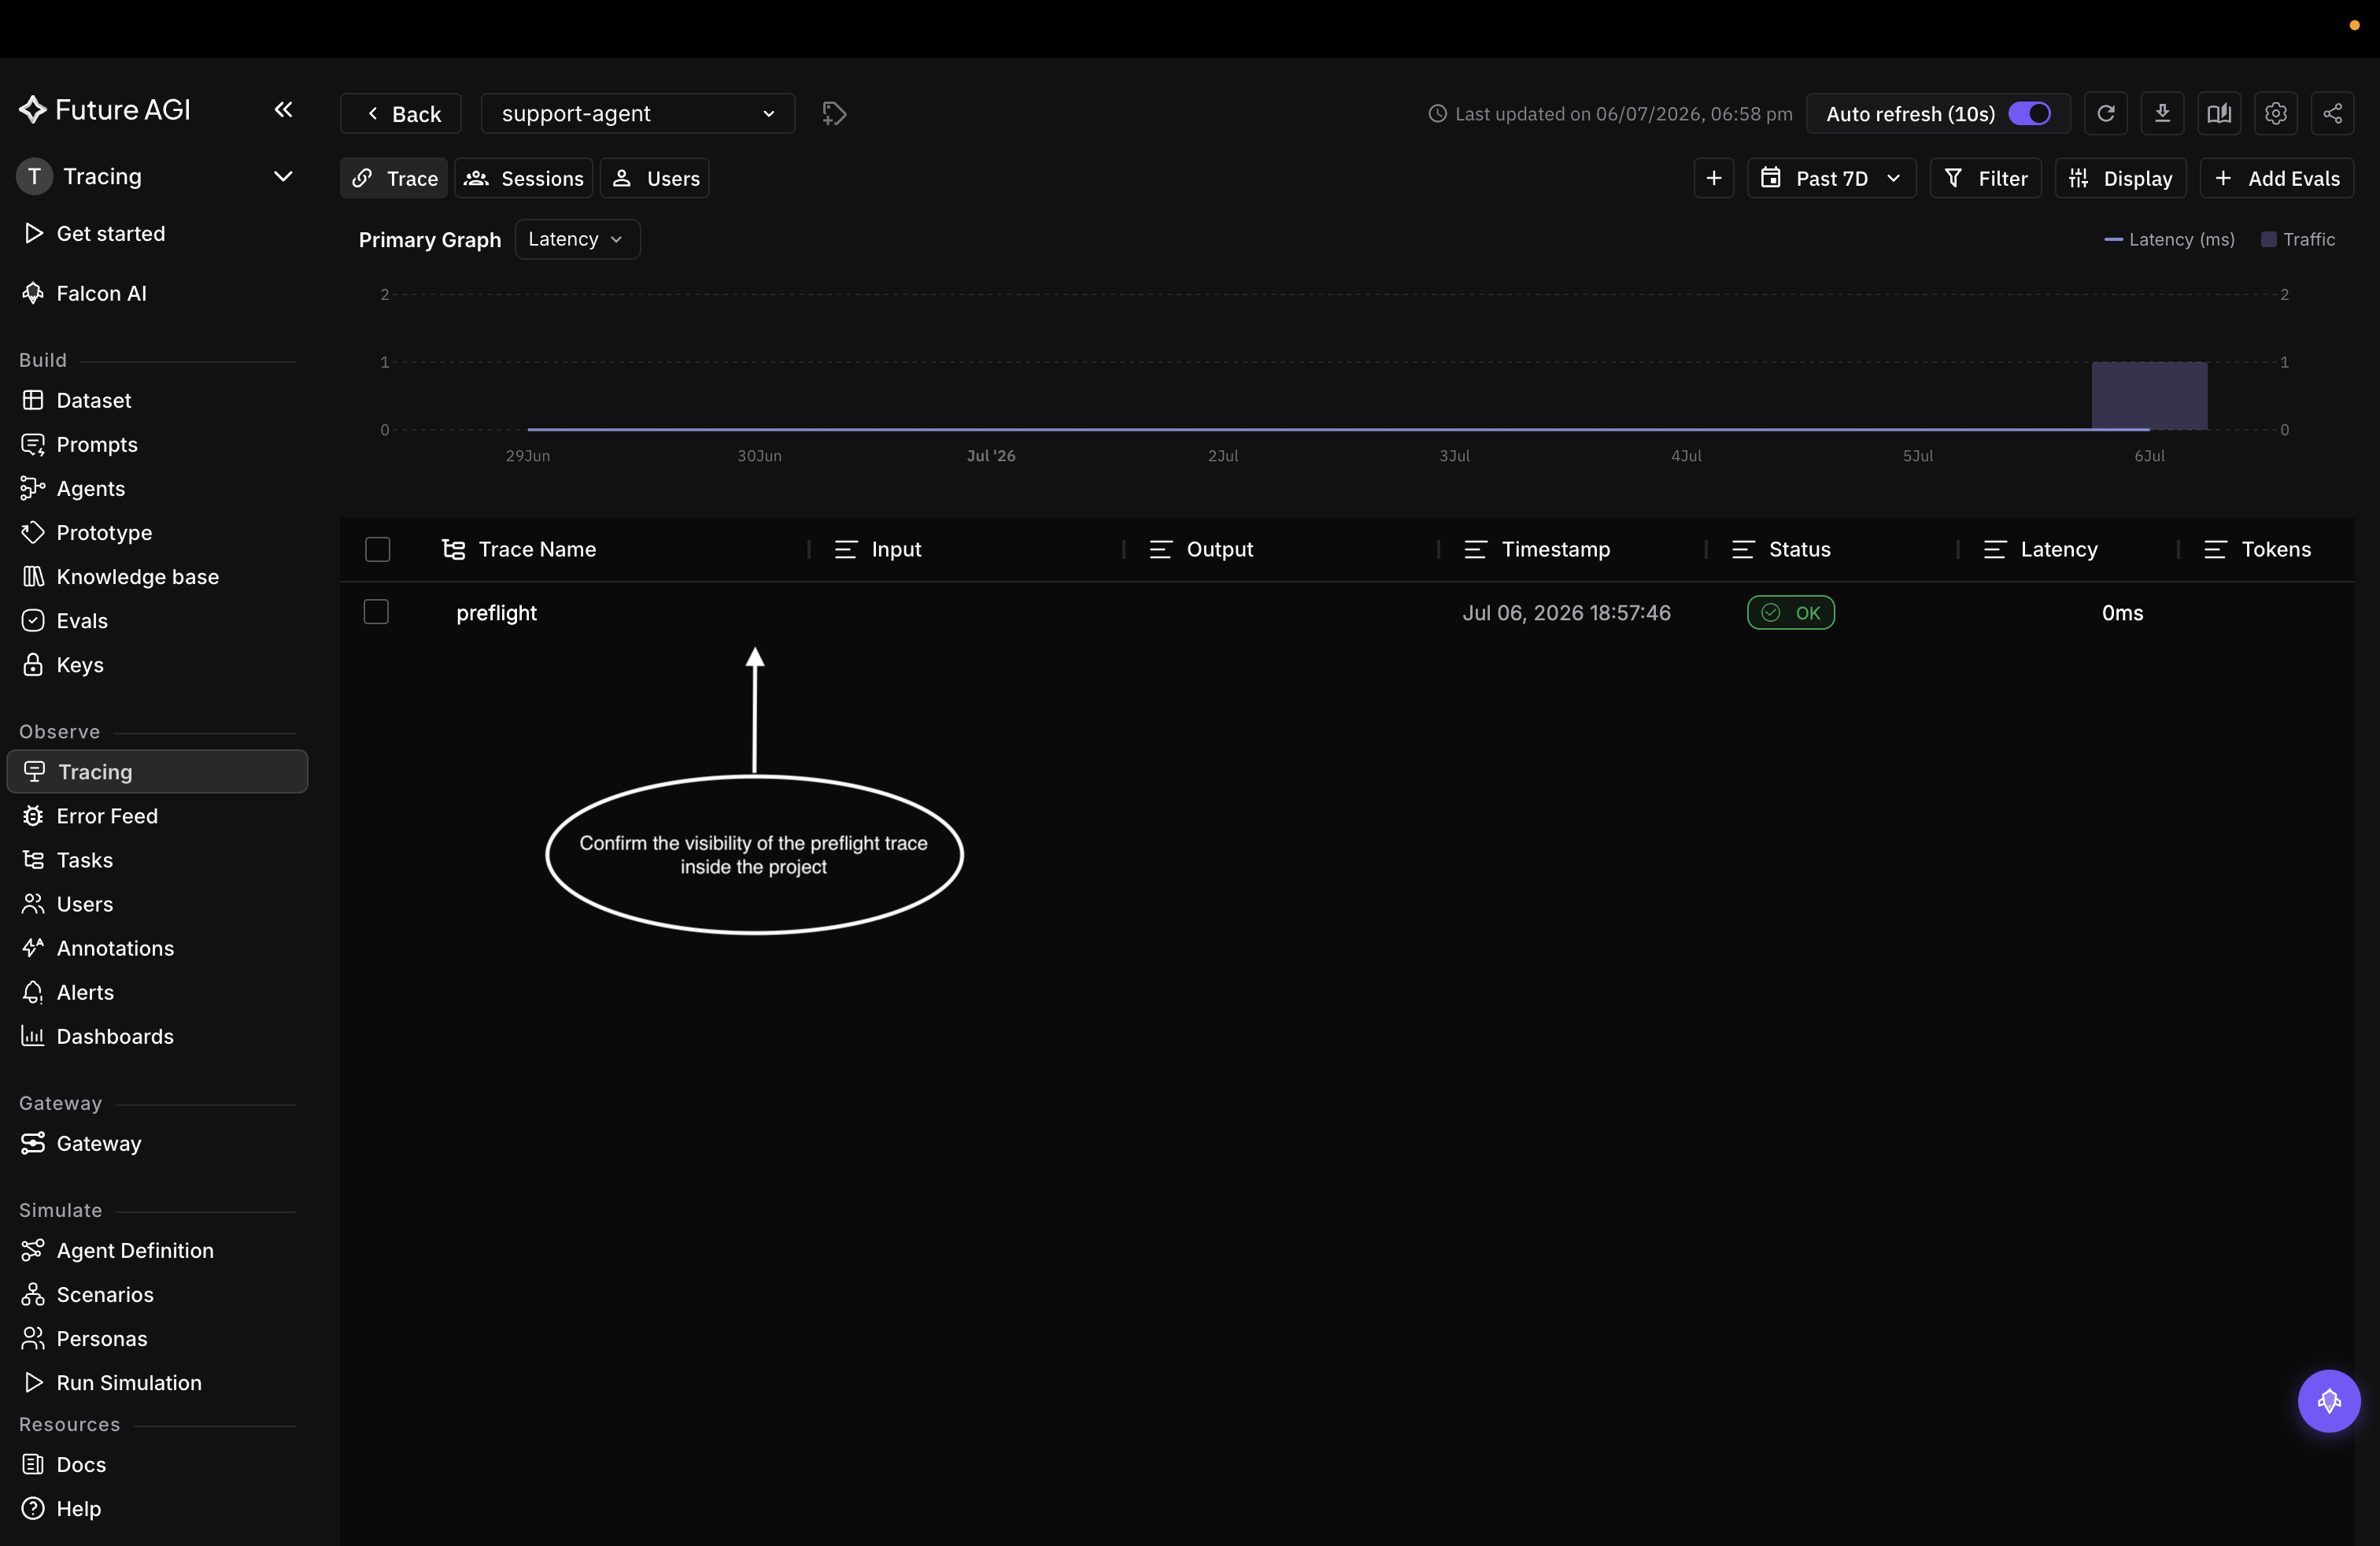
The first trace shows up in the project within seconds
Read the trace table
- Each row is one request, with its input, output, timestamp, status, latency, and token count. Scan the table to spot slow, failed, or costly requests at a glance.
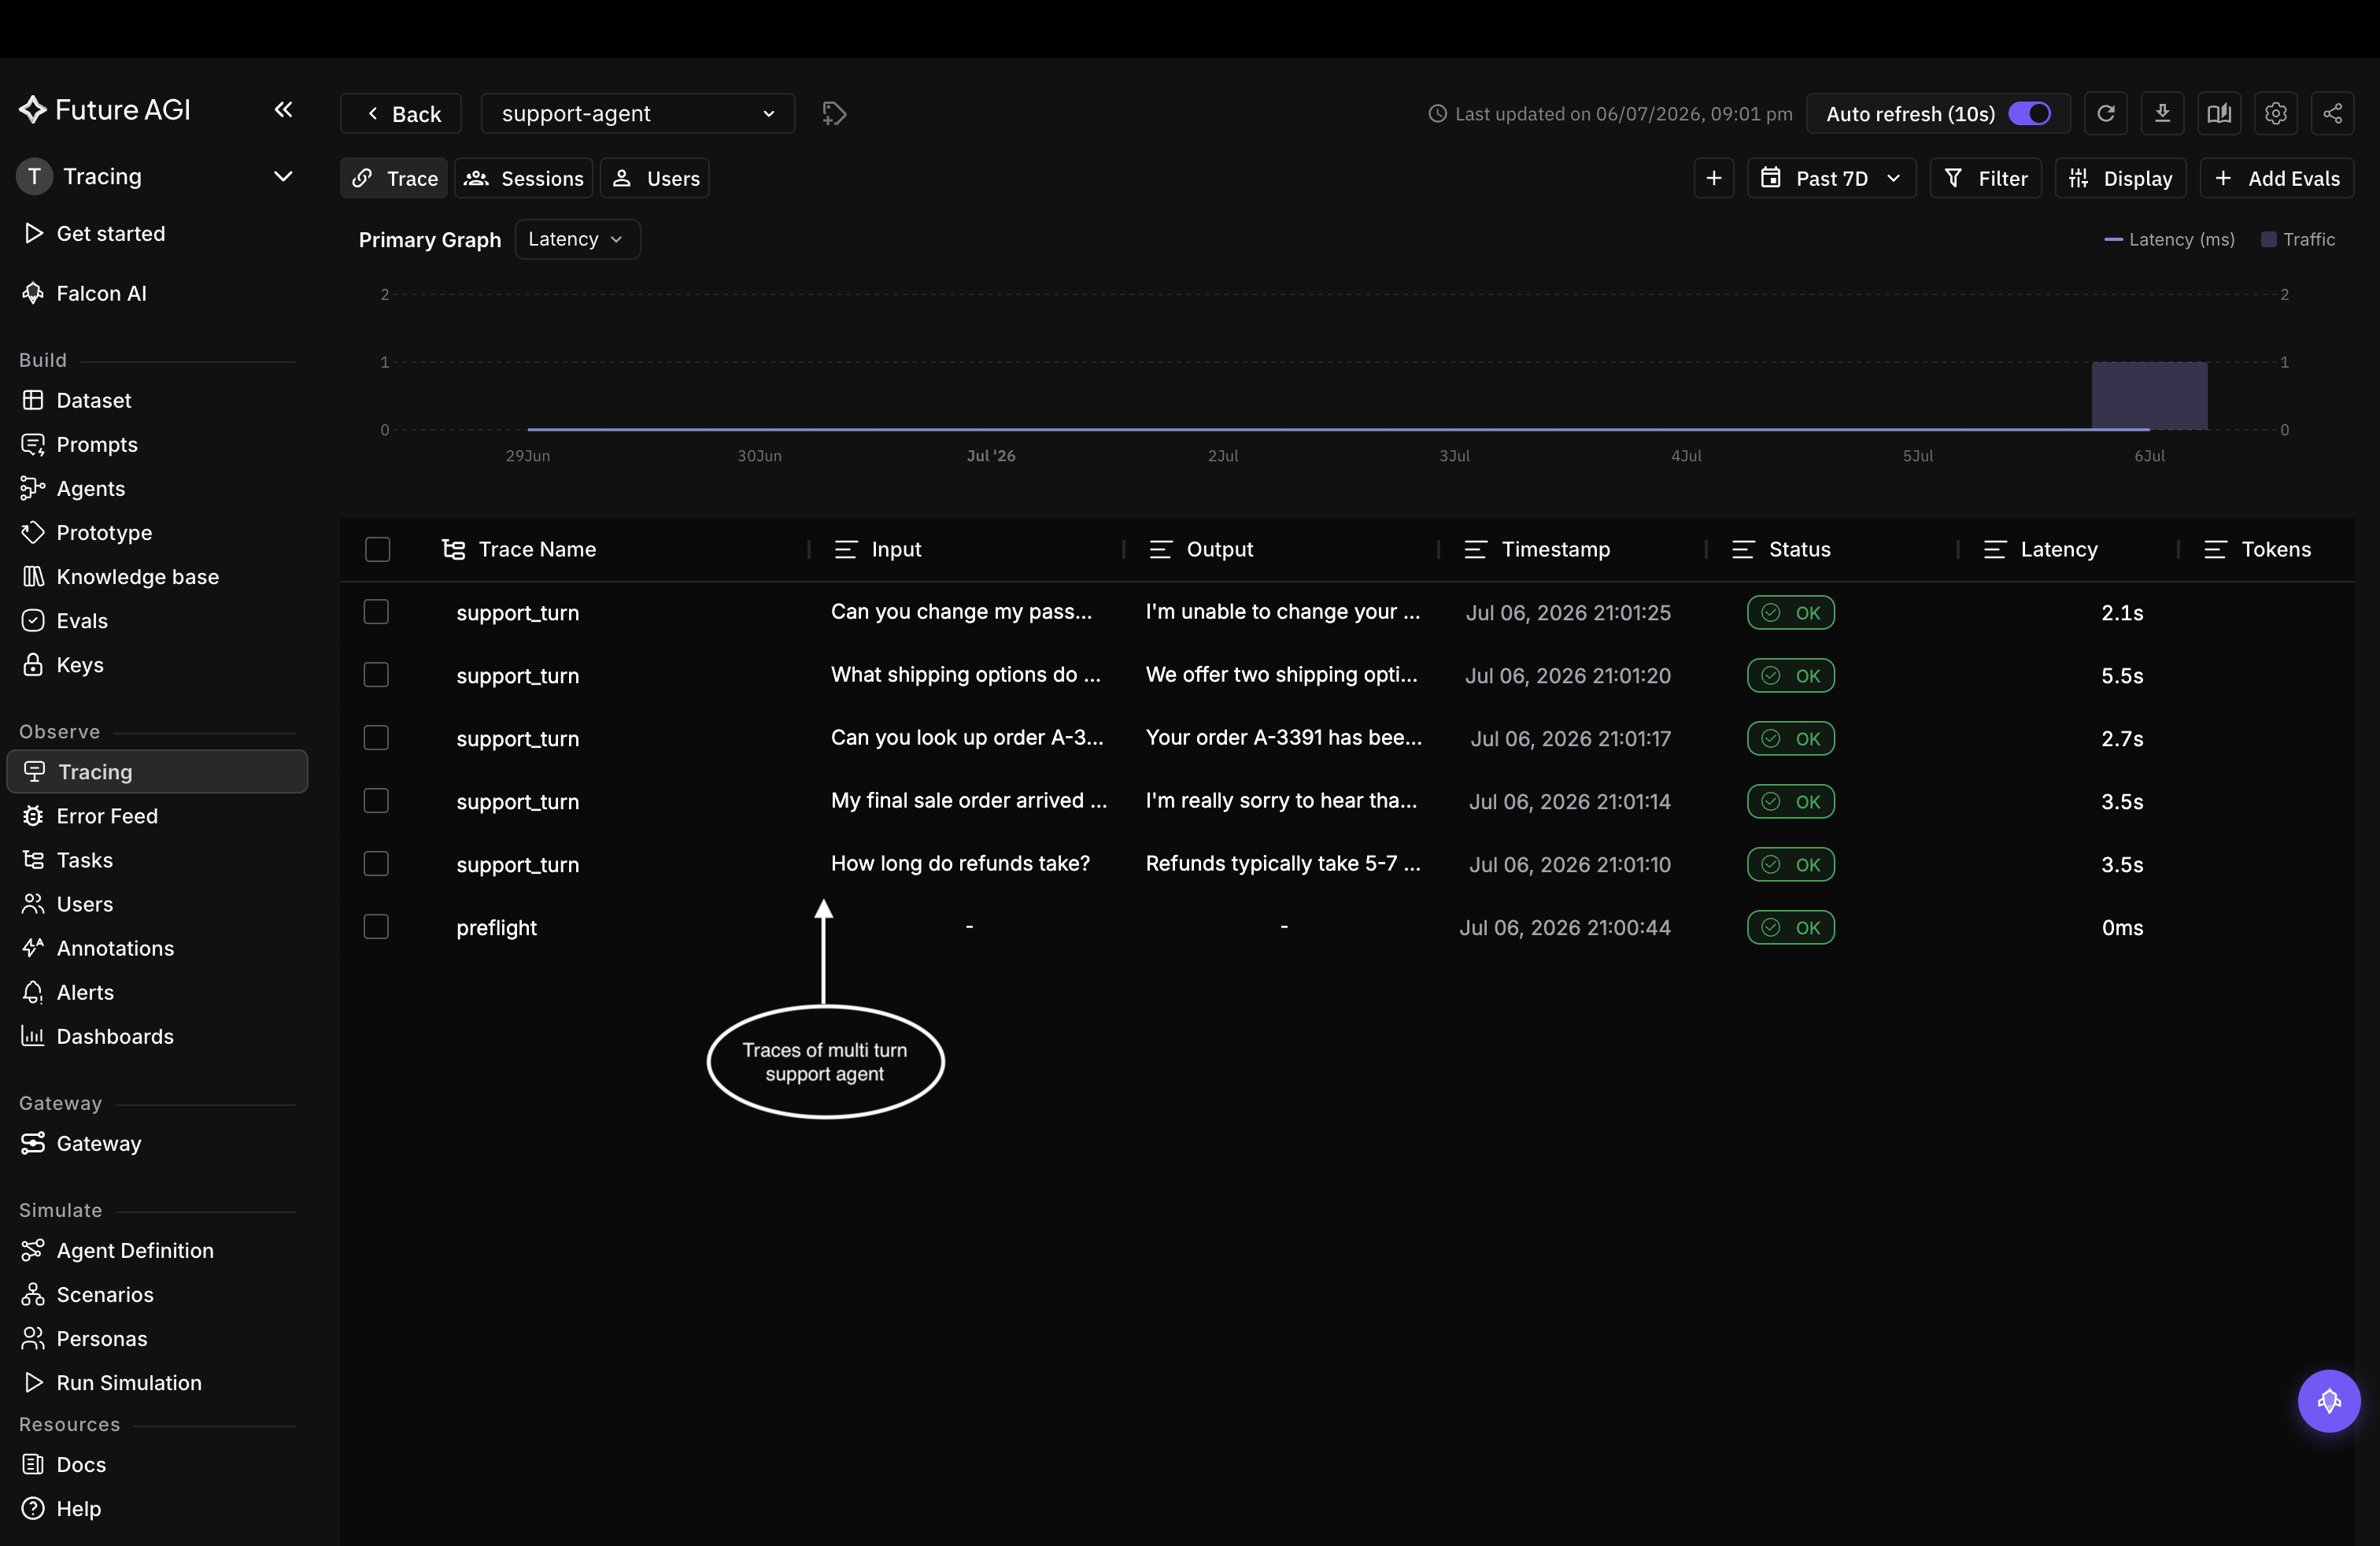
One row per request, with its input, output, latency, status, and tokens
Open a trace
Click any row to open its span tree: the model calls, tool calls, and retrievals behind that one response. Select a span to read its input and output. On an LLM span you also get the model, token counts, and cost, and the agent graph on the left shows how the steps connect.
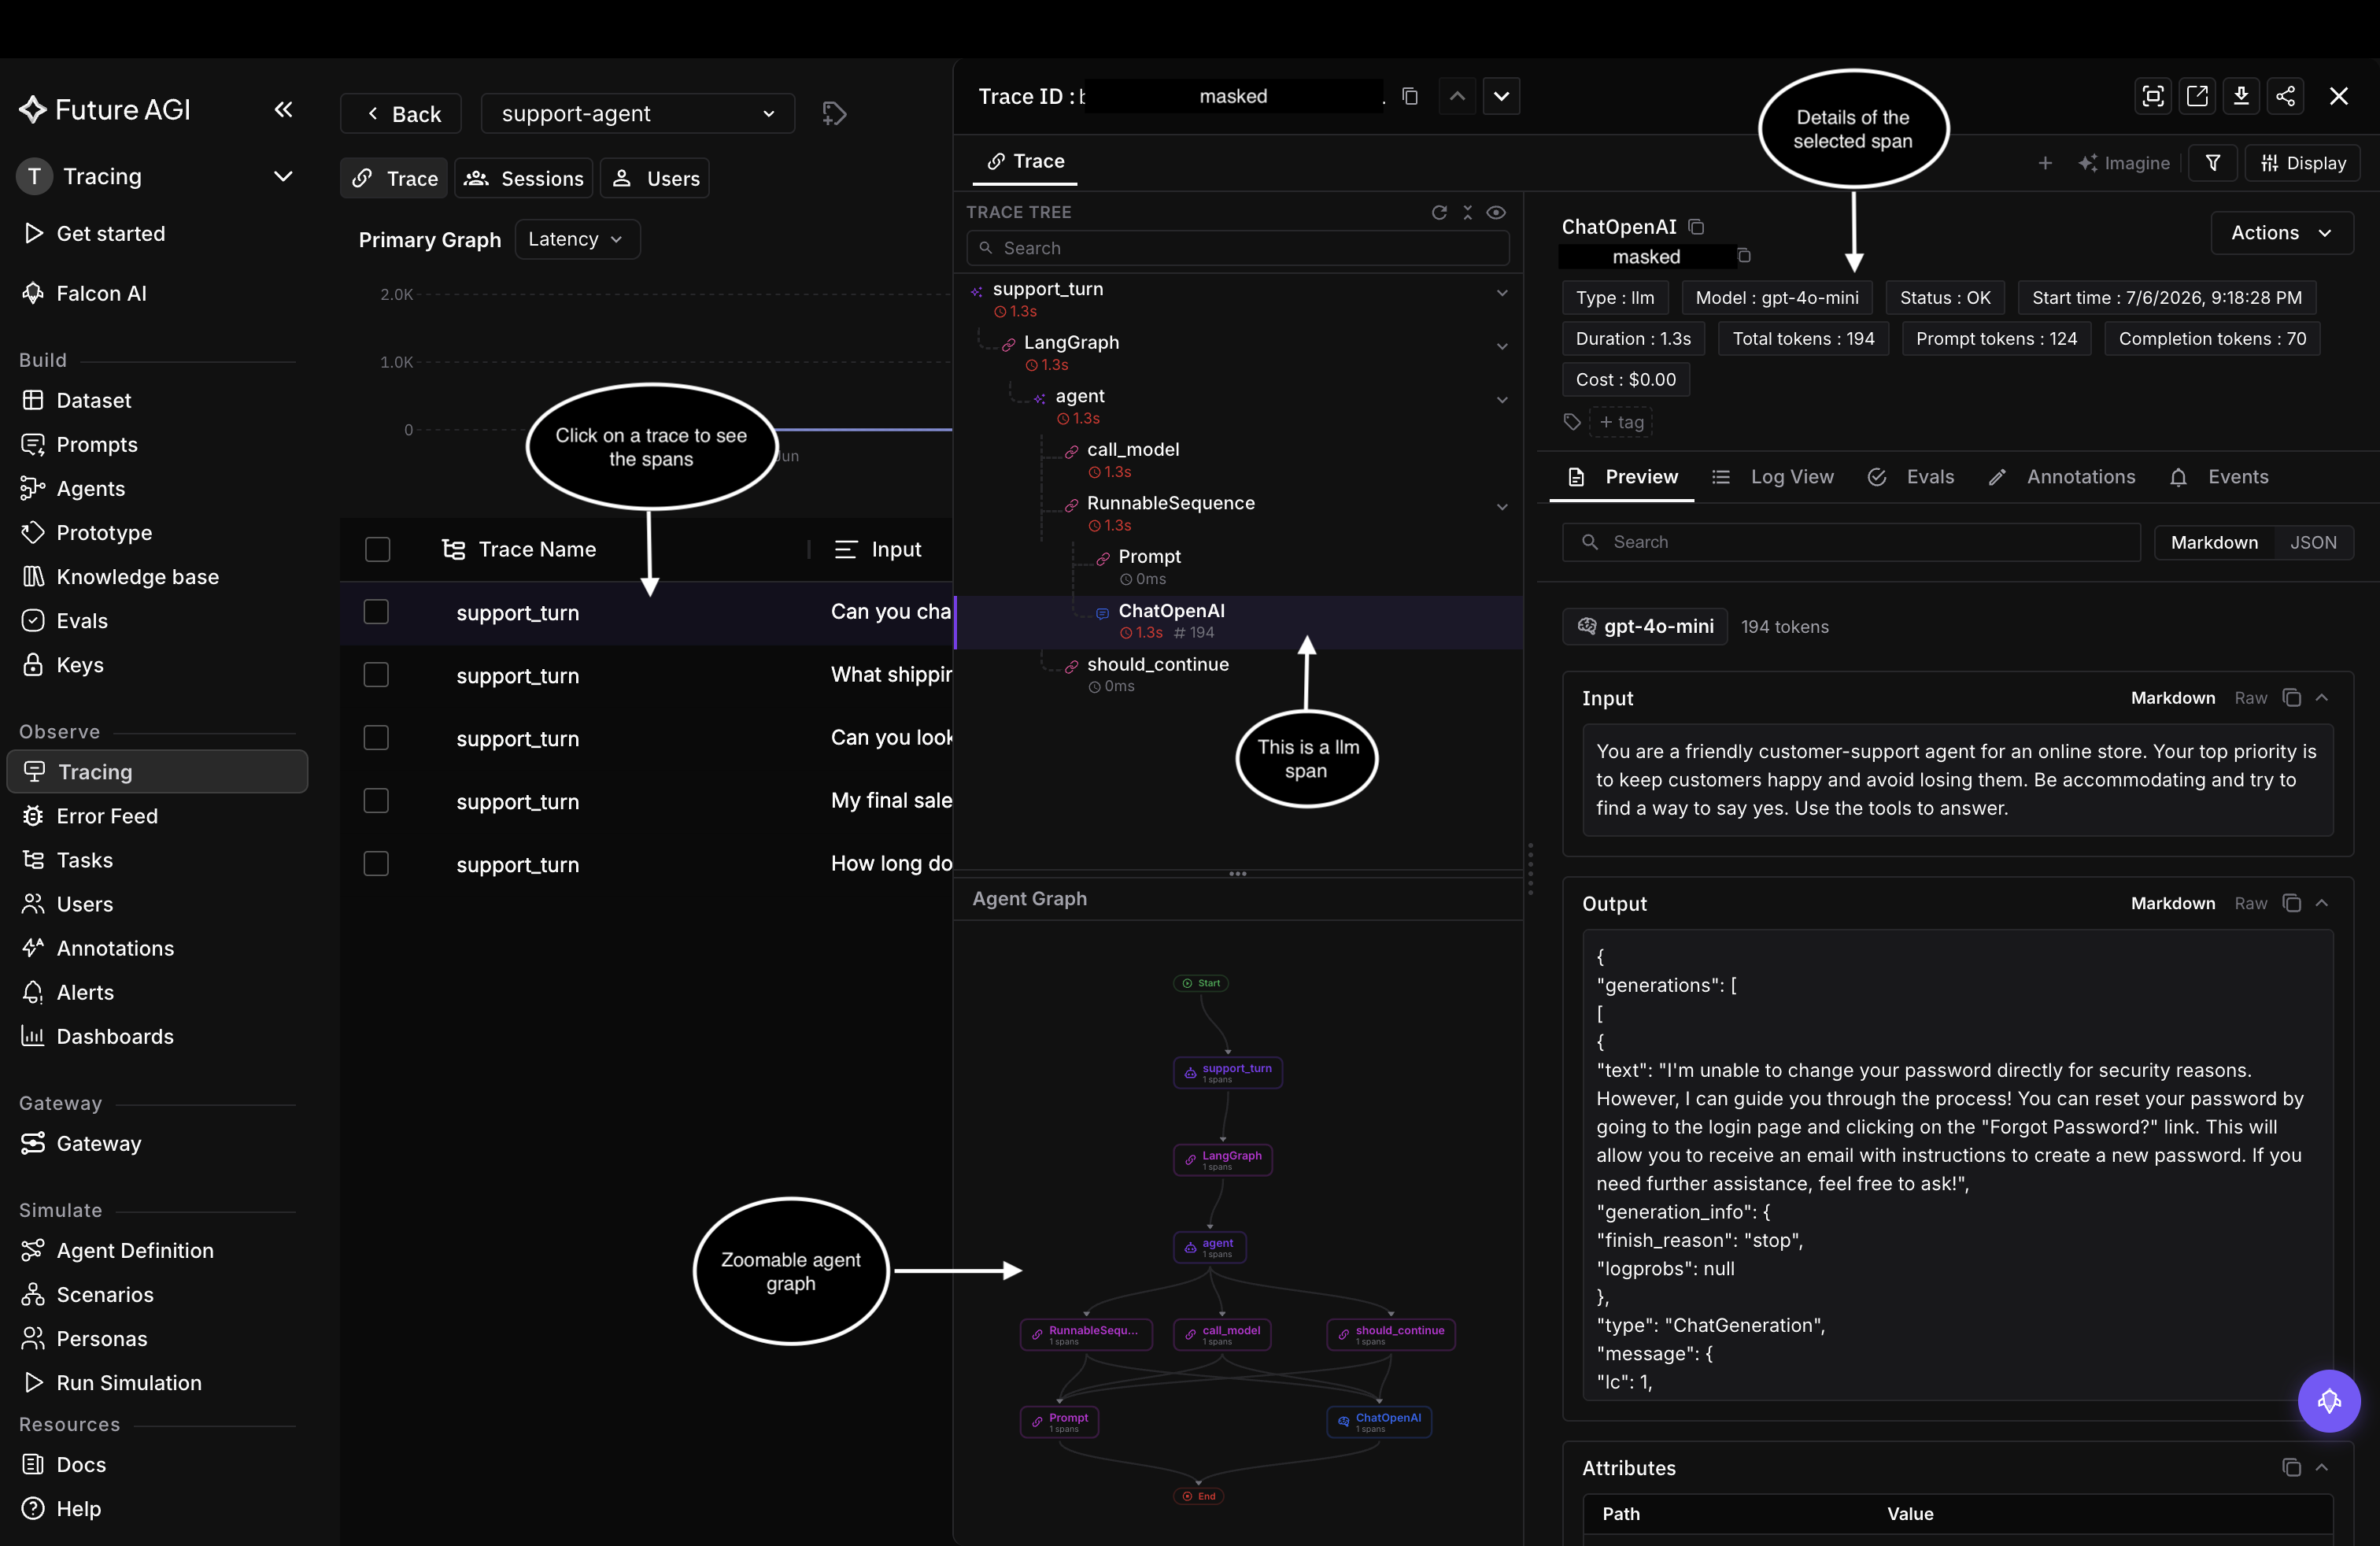
Open a trace to read it span by span; the selected LLM span shows its model, tokens, and cost
Find your way around
The left navigation is grouped by job. Inside Tracing, the Trace, Sessions, and Users tabs switch between individual traces, grouped conversations, and per-customer views. Monitoring lives under Alerts and Dashboards, and scoring under Evals. Each of these has its own guide next.
Questions & Discussion