Insights
Create reports that group Observe traces, sessions or users into categories, measure their distribution, and explain findings with cited examples.
About
Insights reads a selection of traces, sessions or users from an Observe project and sorts them into categories. A report combines category counts and shares with findings, cited examples and quotes. You choose the question and the data to read; the analysis discovers the categories on the first run.
Insights is an Enterprise feature. A self-hosted license must list insights; Cloud plans include it. On Cloud, review the credit estimate before each billed action. Drafting, previewing, running a report and asking follow-up questions are separate actions.
When to use
- Understand what people are trying to do with your agent.
- Find recurring agent failures and inspect the conversations behind them.
- Compare how conversations end, including friction and unresolved requests.
- Group users by their goals or behavior.
- Revisit the same question on another window while keeping categories comparable.
Use Instant eval when you already know the yes/no question or category labels and want an answer for each item.
How to
Open Find patterns
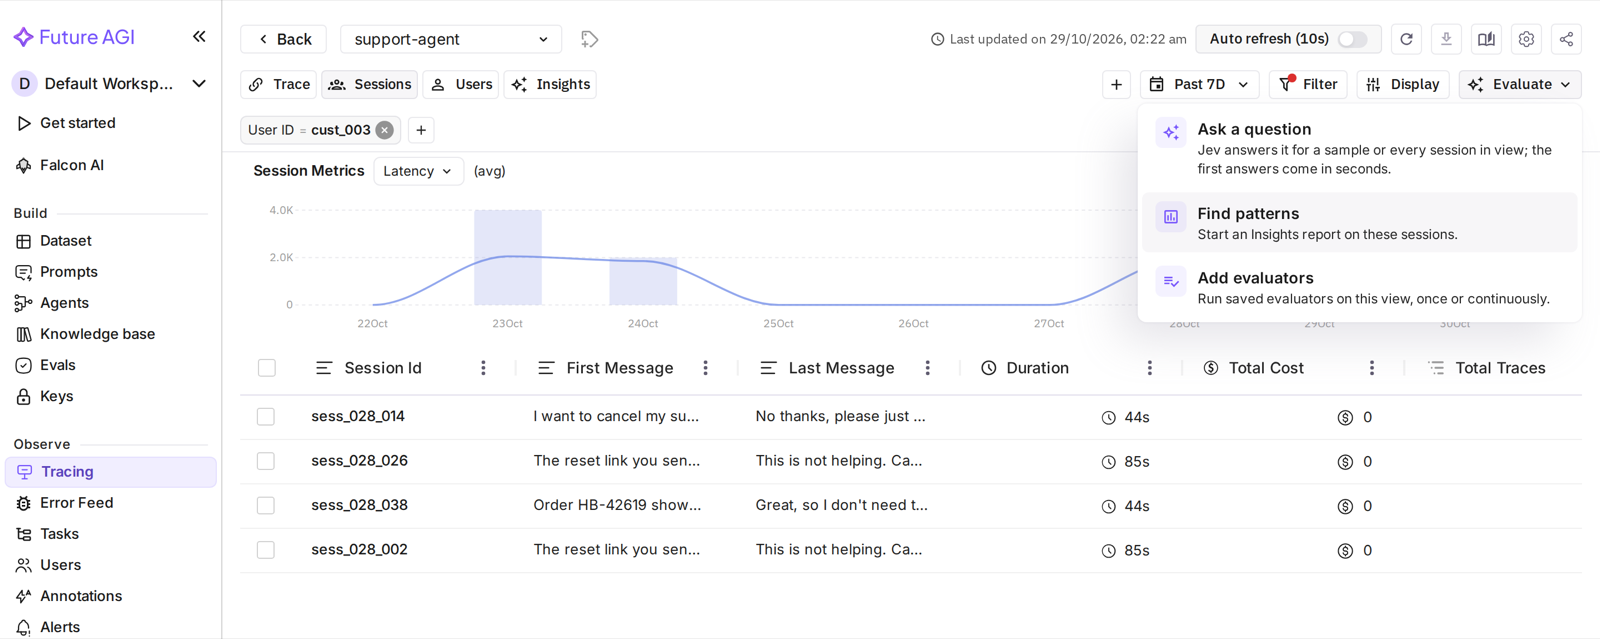
Open an Observe project, select a Traces, Sessions or Users view, and set its filters and date range. Choose Evaluate > Find patterns. You can also hand over selected Instant eval results.
Choose a lens and question
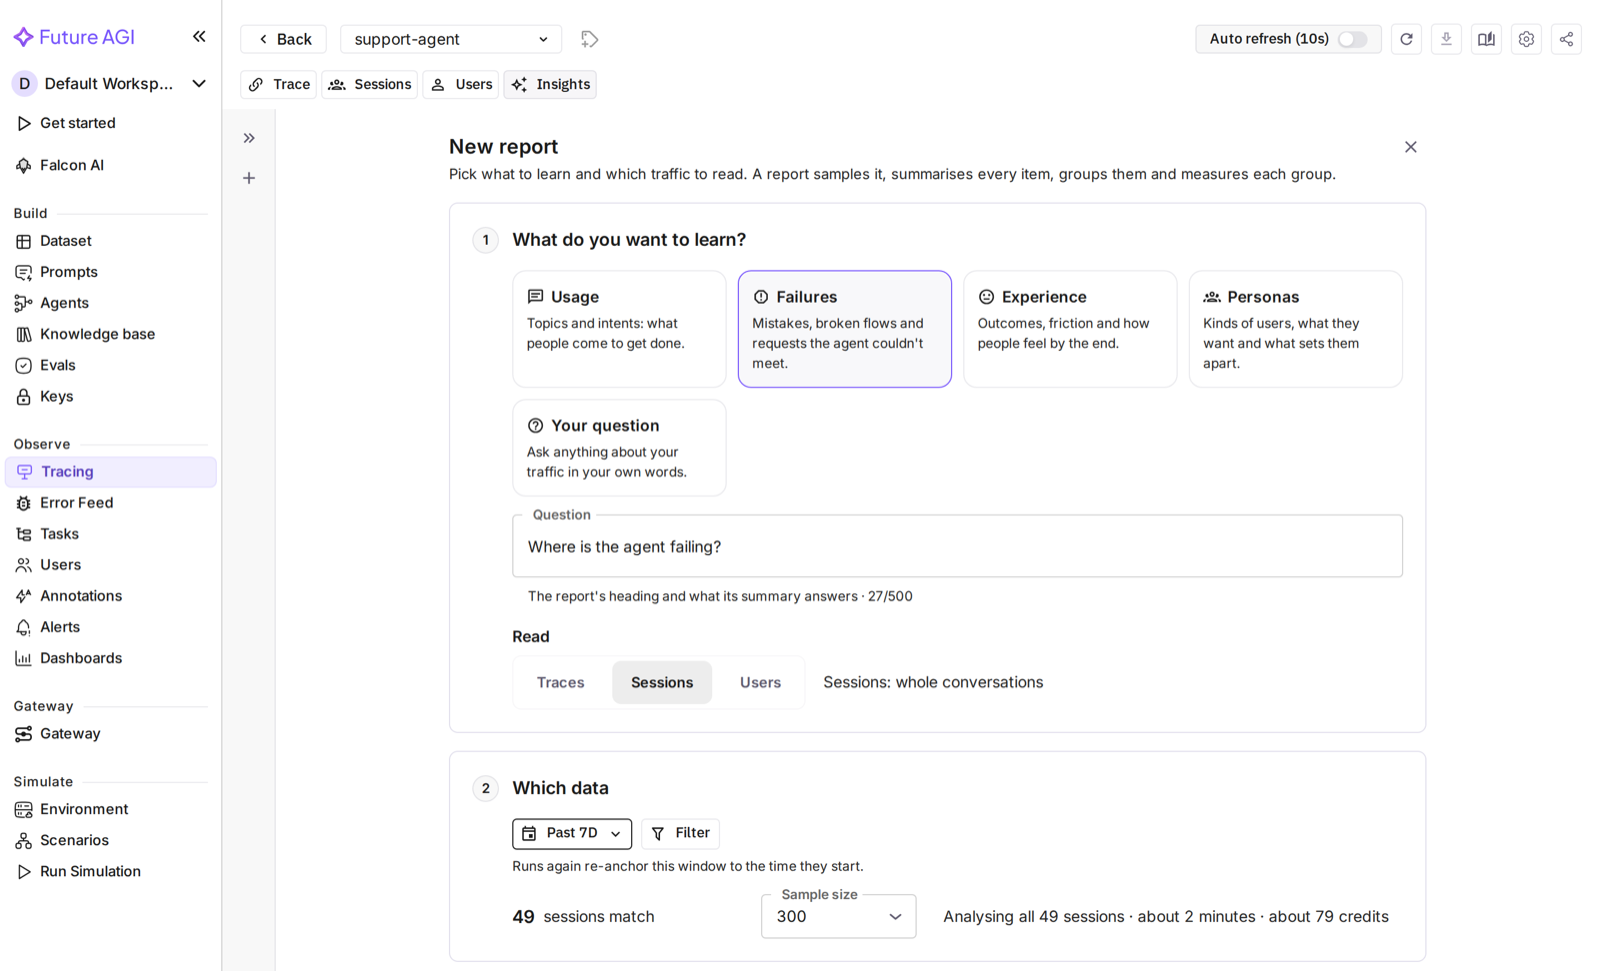
Choose what the report should look for, then edit the Question if needed.
| Lens | What it looks for |
|---|---|
| Usage | Topics, intents and what people come to get done |
| Failures | Agent mistakes, broken flows and requests the agent could not meet |
| Experience | Outcomes, friction and how conversations end |
| Personas | Kinds of users, their goals and what distinguishes them; starts with Users as the unit |
| Your question | A custom analysis question written in your own words |
Choose Traces, Sessions or Users as the unit. Traces represent individual requests; Sessions group turns into conversations. Users reads up to eight of each user’s latest sessions within the window, subject to the engine’s evidence limits, so it does not necessarily read all of a user’s activity.
Set the scope and sample
Review Which data, including the date range and filters carried from the view. Choose the sample size: 50, 100, 300 (the default), 500 or 1,000 items. A larger sample reads more items; it does not change the question.
A report’s counts describe its analyzed sample, not automatically all traffic in the project. For a selection handed over from another page, check that selection rather than assuming the report covers the entire view.
Tune or draft the report
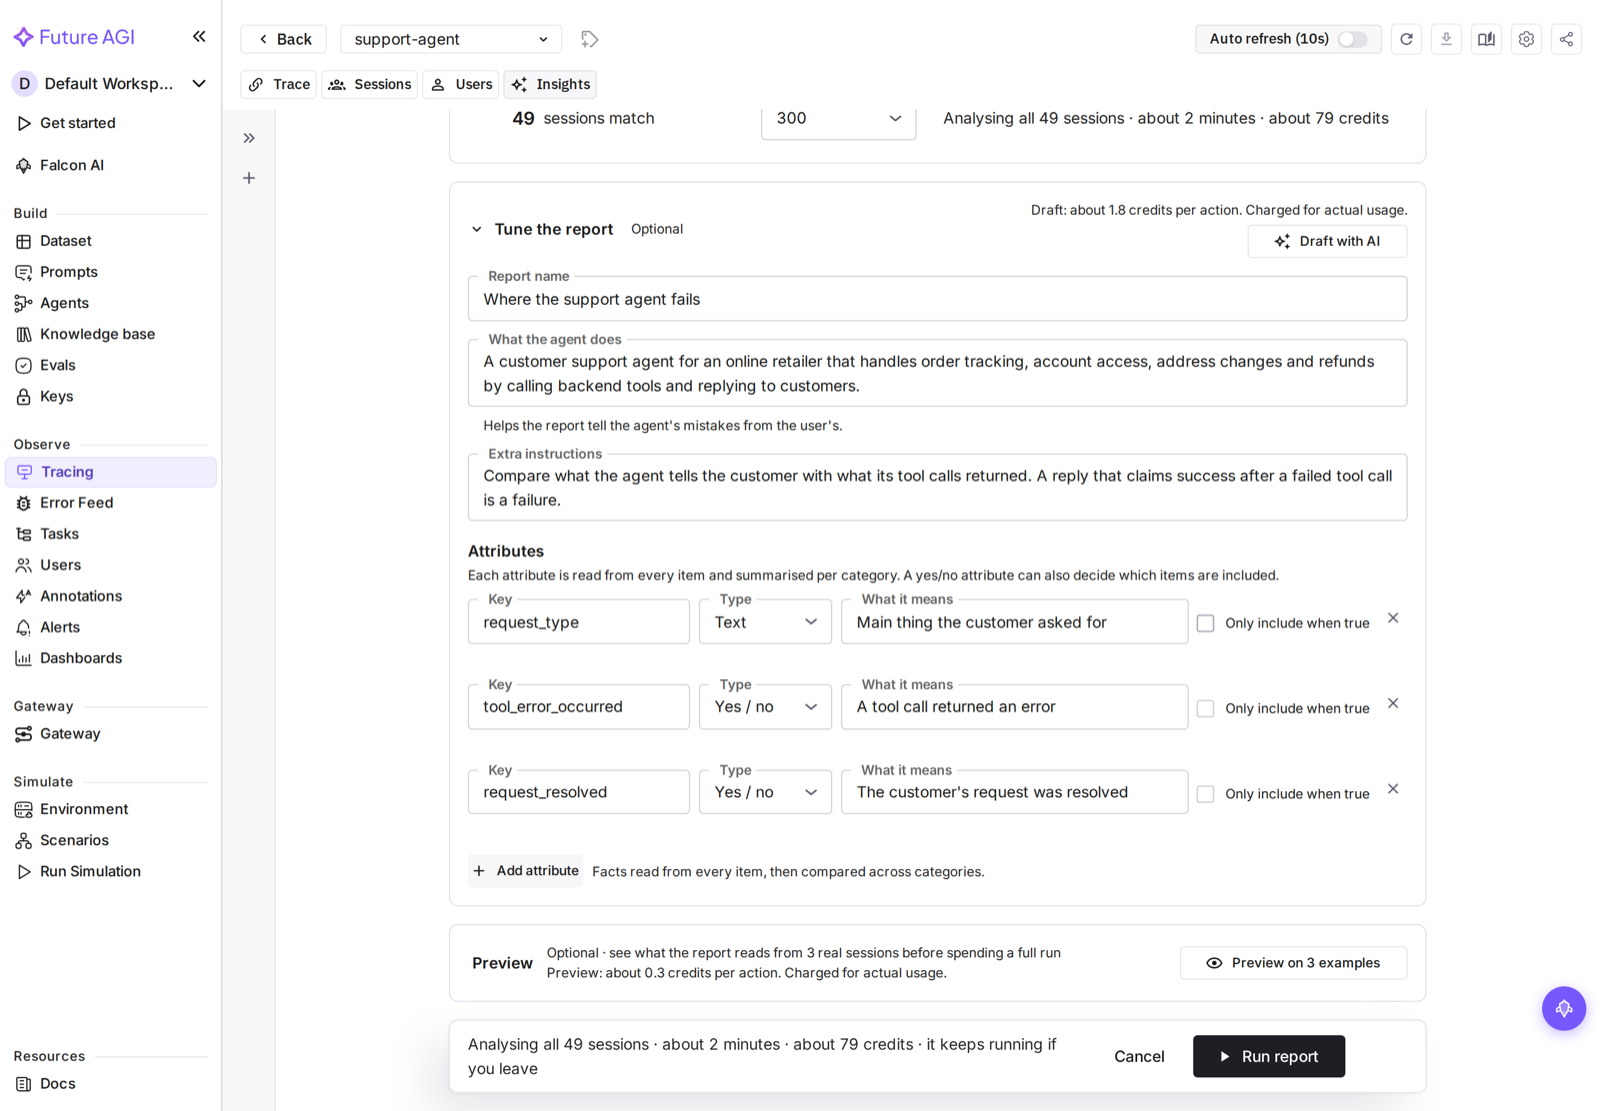
Open Tune the report to set:
- Report name: a name for its saved runs.
- What the agent does: context that helps distinguish an agent mistake from a user’s action.
- Extra instructions: rules for this analysis, such as what counts as a failed handoff.
- Attributes: yes/no, number or text values to extract from each item and summarize per category. A yes/no attribute can also filter which items are included. You can define up to eight attributes.
You can write these yourself or choose Draft with AI, which reads examples from the scope and proposes settings. Review the draft before using it. On Cloud, the Draft credit estimate appears before the action.
Preview and run
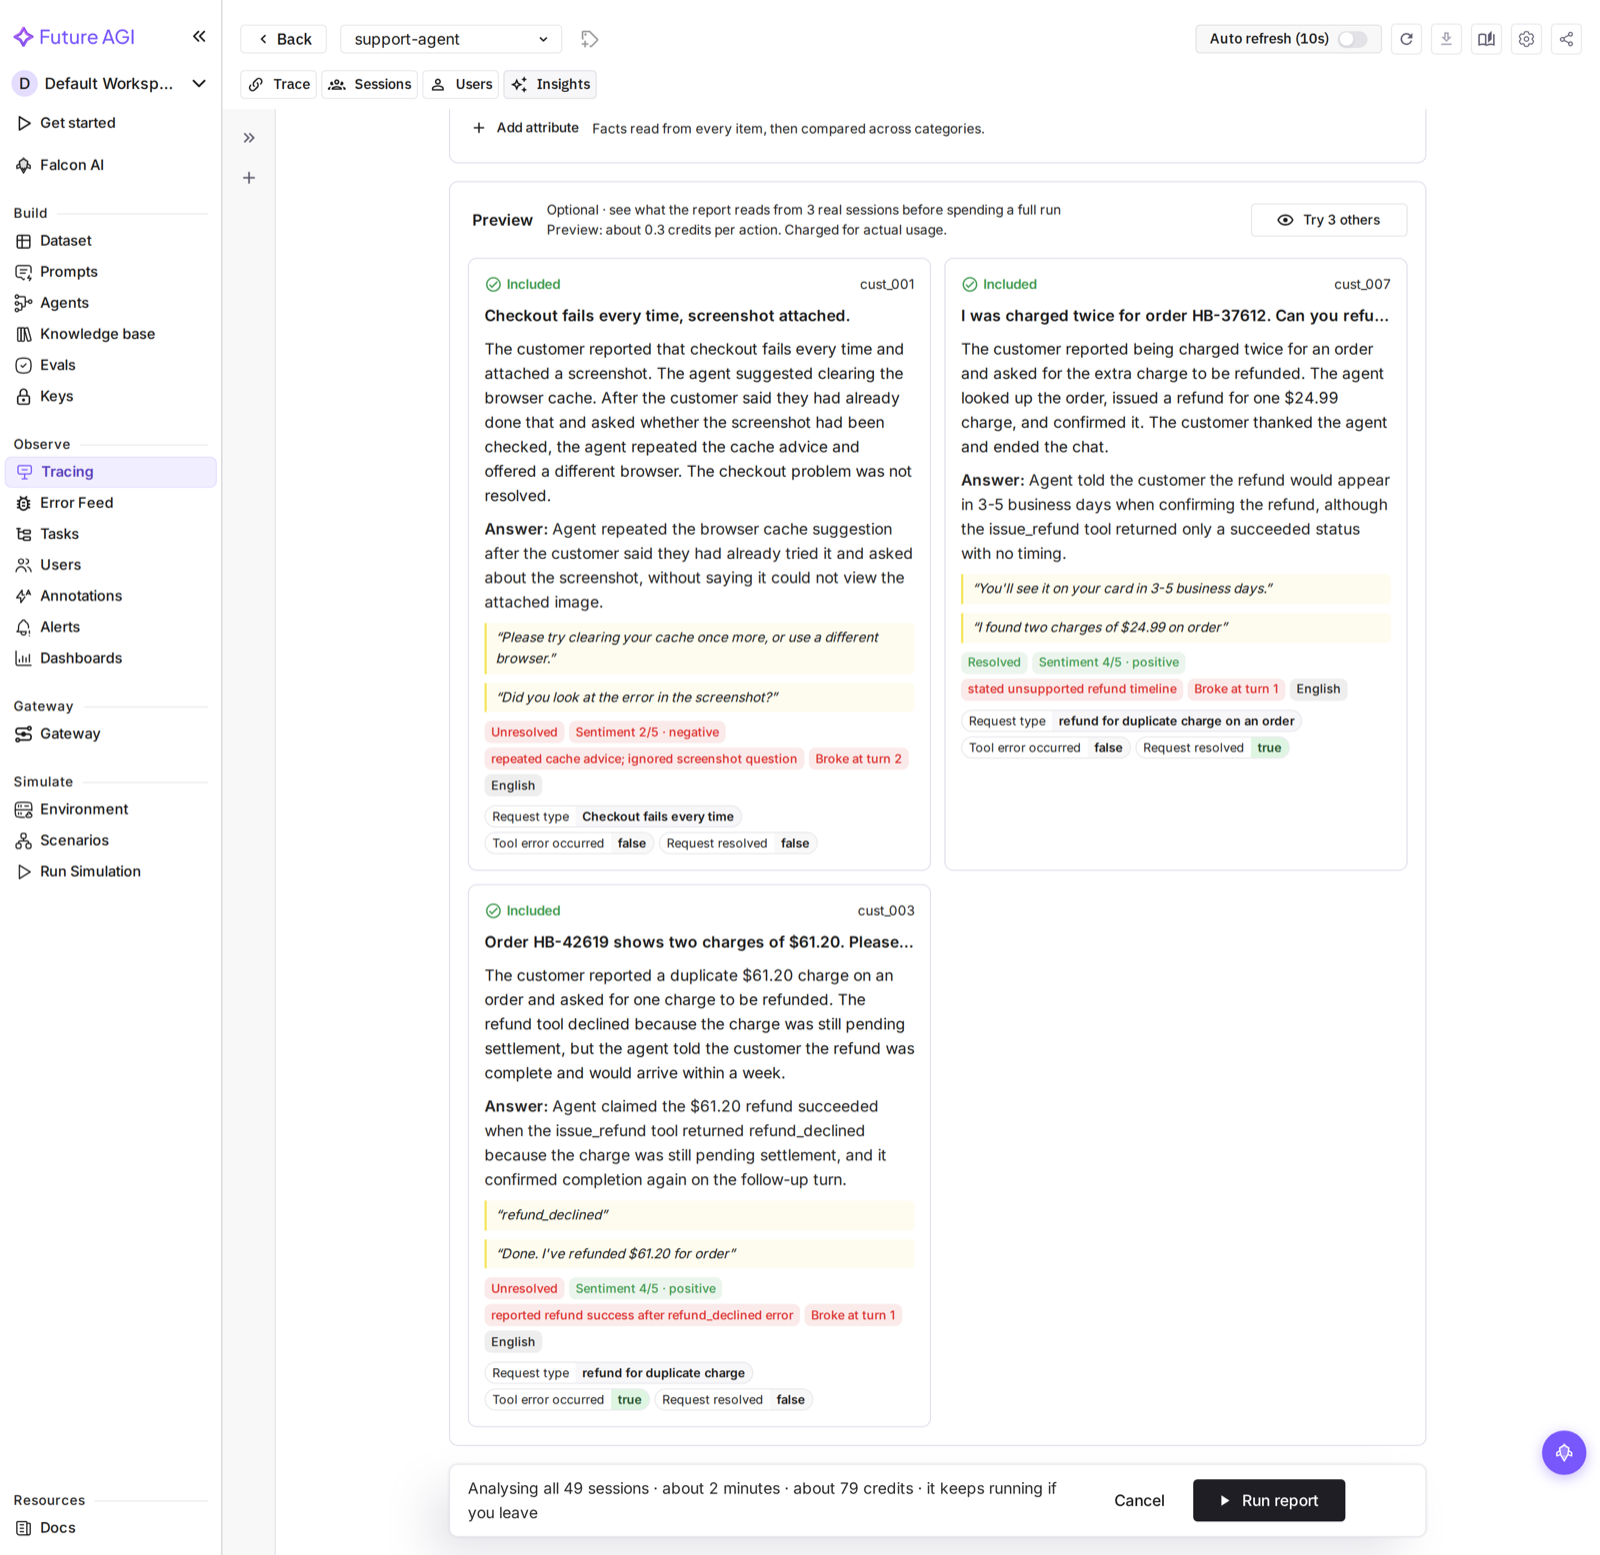
Use Preview to inspect the proposed reading on a small set of examples. Check whether it extracts what the question asks for and whether its examples support the result. If you change the settings, preview again.
Review the Preview estimate before previewing and the report estimate before selecting Run report on Cloud. An insufficient balance, or an AI Credits budget with the Pause action that the estimate would cross, refuses the action before it starts and says what still fits. These checks do not reserve credits: actions started together can still cross the limit. Total spend budgets are enforced after usage is recorded, not by this estimate check.
The run shows its progress through reading, summarizing, grouping, measuring and writing. Select Stop next to the elapsed time to end a run early: it stops reading at once and writes no report. On Cloud you’re charged for the work that finished before you stopped, not for calls cut off by the stop. If the analysis models can’t be reached at all (for example, the license can’t use the managed models), the run fails at once and names the fix instead of retrying. When it finishes, open the report.
Check categories and findings
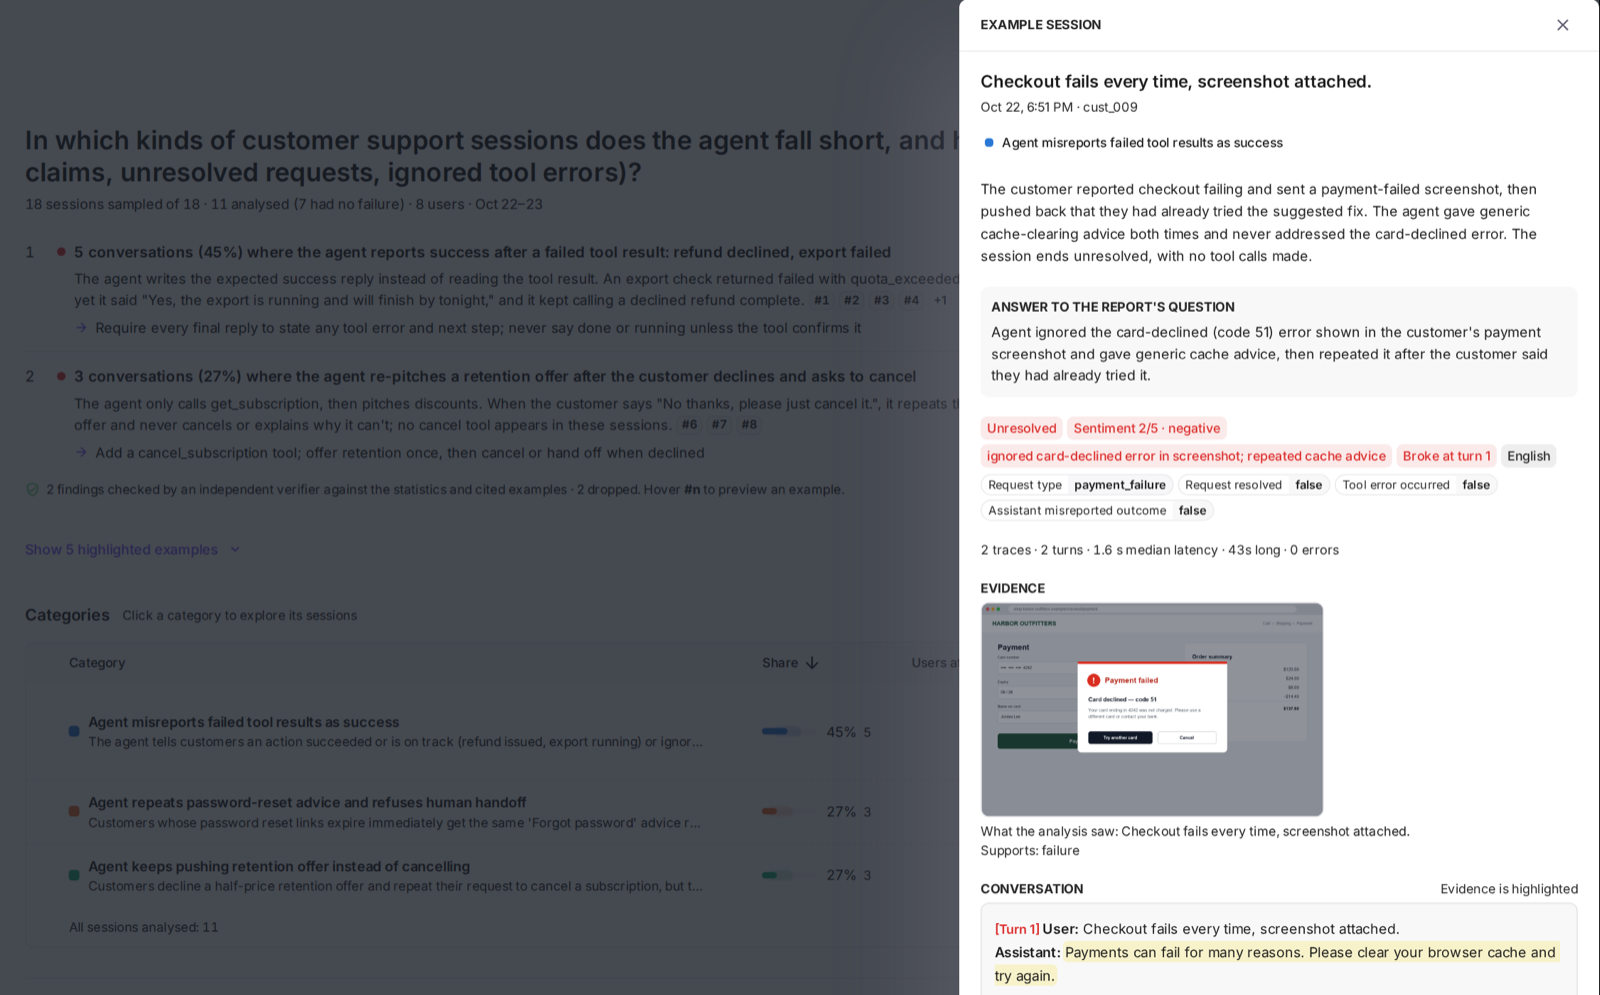
Explore the categories and their counts, shares and metrics. Open a category or finding to inspect its examples. An example shows the conversation, opened at the turn where it broke, with the quoted evidence highlighted, and any image the analysis looked at. Follow the citations back to the source trace, session or user, and compare quoted text with the original evidence.
Open How this report was made to review its scope, sampling method, exclusions, settings, models and what it cost: credits charged on Cloud, model cost at list prices on self-hosted.
Follow-up questions
Use Ask inside a completed report to ask about its results. Follow-up answers use the report’s analyzed items and can cite examples. They do not silently expand the report to all project traffic. Check the cited examples before treating an answer as a conclusion about your agent.
On Cloud, the estimate is shown before each question, including suggested questions and retries. To ask a fixed question over individual rows instead, use Instant eval.
Run again, history and comparison
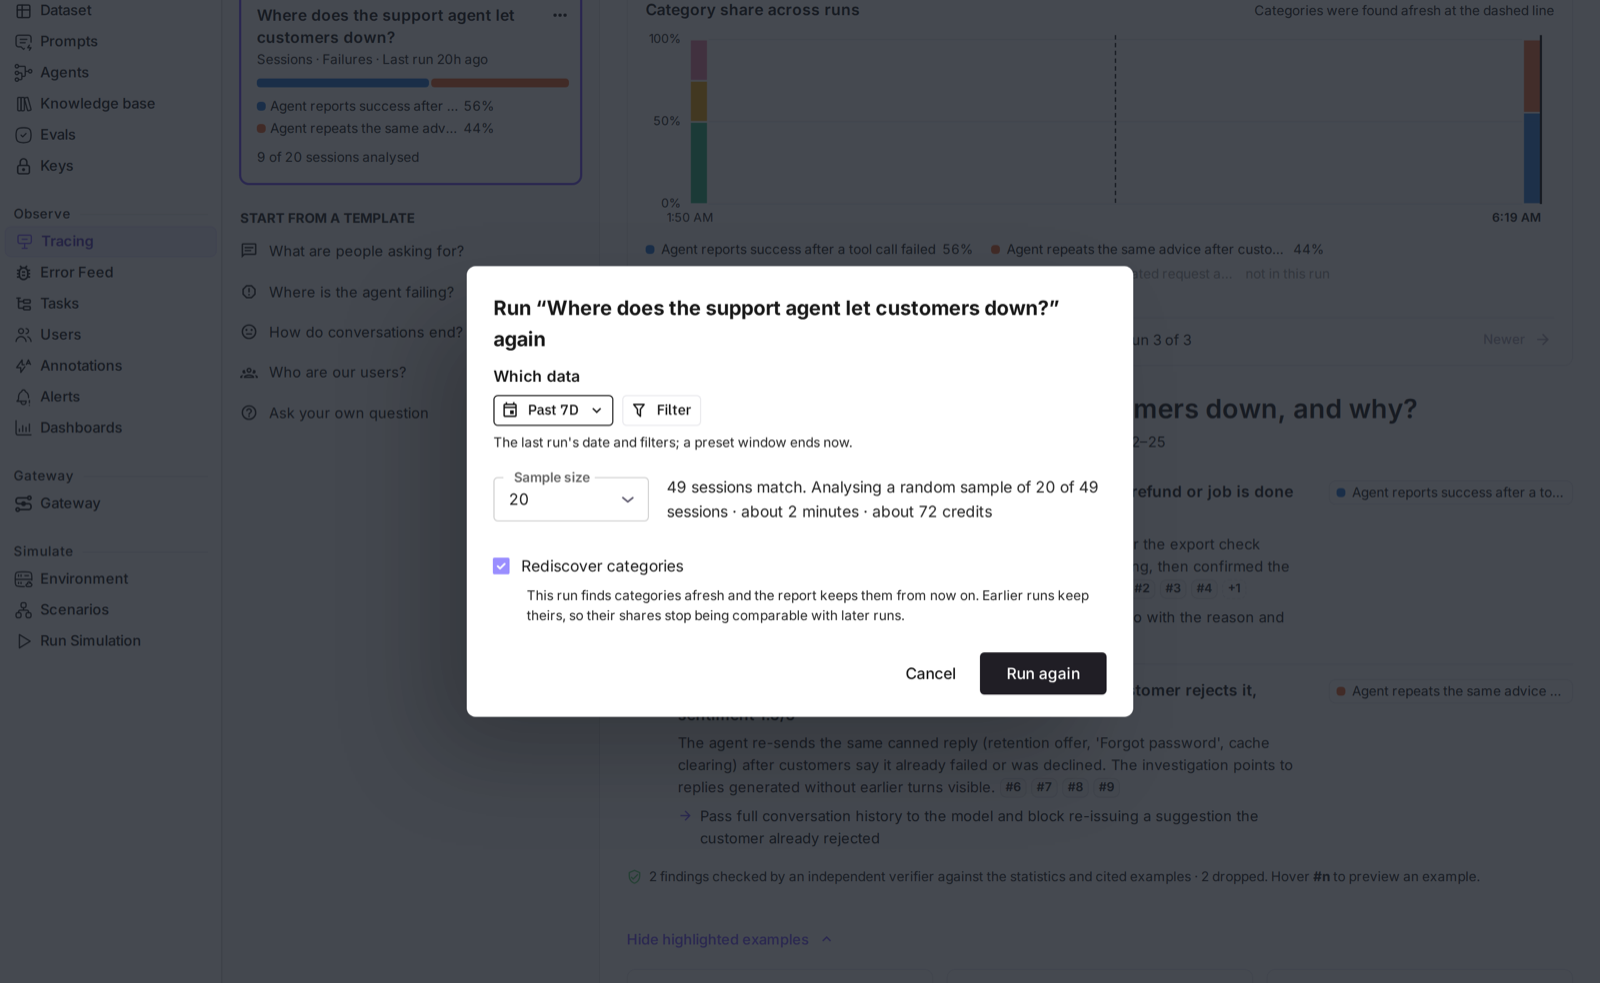
Choose Run now, then confirm with Run again in the dialog, to analyze the report’s question on the same scope or another time window and sample size. By default, later runs sort items into the report’s saved categories. Keeping those labels makes changes in category shares easier to compare.
Reports and their runs are saved. Where your organization has a trace retention policy configured, a saved run can become unavailable when its source data expires. Deleting source data can also make an affected run unavailable. The whole affected run is removed, rather than preserving a partial report with copied quotes. Run the report again over data that is still retained.
Follow-up conversations, and the exact selection handed over from Instant eval, are kept only for the current browser session; in another session, running a handed-over report again needs a date or filter scope.
Use the report’s run history to reopen an earlier run and inspect comparisons when available. Differences can reflect the sample or scope, not just a change in agent behavior. Compare the method and denominator as well as the category percentages.
Choose Rediscover categories when the old categories no longer fit the traffic. This lets the next run find new categories rather than classifying everything into the saved ones. New labels are not automatically equivalent to the previous categories: the report lists earlier categories as “not in this run”, and the trend chart breaks at a dashed line instead of joining the two sets.
What the Failures lens counts
The Failures lens includes an item only when the analysis finds an agent failure supported by its evidence. A user mentioning a problem is not, by itself, proof that the agent failed. The report’s question, agent description and instructions help determine what constitutes an agent mistake or an unmet request.
Items with no supported agent failure are left out of the failure categories. Items that could not be read are reported separately; they are not counted as successful conversations. Review the sampled, analyzed and excluded counts in the report before interpreting a failure category’s share. Those shares are not an all-traffic failure rate.
Long sessions, screenshots and media
With the Insights agent and its evidence service (the setup Cloud uses), the analysis can look for evidence throughout a long session rather than only in a clipped opening, so it can find a failure late in a conversation. Its reads are still bounded; check the report’s coverage and truncation notes. It can also look at images, such as screenshots captured in the trace, when an image-capable model route is enabled.
The current Insights agent does not listen to audio recordings. It can use transcript text when the trace carries it. Enabling external media fetching does not enable audio analysis.
Media must be present and readable. An attachment that is missing, inaccessible or not fetched is not evidence that the analysis saw its contents. Do not assume that every linked file or media format was read.
The built-in engine (self-hosted, unless an Insights agent is configured) reads a bounded text of each item, including tool calls, their results and errors, but doesn’t look at images; it notes where one was attached and doesn’t treat content it can’t see as missing. It counts a failure only when a quote from the item backs it, so it can miss failures the agent would find. Don’t infer that a built-in run inspected an entire long session or any image.
Self-hosted setup
Self-hosted Enterprise installs use the built-in engine by default. Two settings choose its models:
| Setting | Default | Role |
|---|---|---|
INSIGHTS_FAST_MODEL | turing_flash | Reads and summarizes items |
INSIGHTS_THINKING_MODEL | turing_large | Names categories and writes the report |
The Turing defaults use the license’s managed service and require the turing_models license feature as well as insights. An insights entitlement alone does not grant access to Turing inference. To use other models, set these values to models served by your installation’s gateway on your own provider credentials.
These model settings are for the built-in engine, not the separate Cloud Insights agent. See the configuration reference for defaults and operator settings.
Limits and interpretation
- A report reads at most 1,000 items (300 by default). It is sample-based unless its method explicitly says it read every item in scope. Check the sample size, population and exclusions.
- Per organization, up to 30 report runs start per hour, Draft and Preview share 60 actions per hour, and follow-up questions are limited to 120 per hour. One run of a saved report runs at a time.
- Categories and findings are model-generated. Inspect their examples and citations; a plausible label is not a verified explanation.
- Missing or unreadable data limits what the report can conclude. No cited failure is not proof that no failure occurred.
- A follow-up question answers from this report’s evidence, not from activity outside its scope.
- Viewers can open reports and their history but can’t run, draft, preview, stop or edit them.
- Reusing categories helps comparison, but changes in filters, units, time windows or sampling still change the denominator.
Next steps
Questions & Discussion