Display options
Choose which columns show, how rows are grouped, and how the trace table is laid out.
Display options control how the trace explorer looks: which primary view sits above the table, which columns are visible and in what order, and how rows are grouped. This guide tunes them on the support-agent project from the Observing a LangGraph agent cookbook.
Open the Display menu
Click Display at the top right of the trace explorer. One menu holds the primary view, row height, columns, metrics, and grouping.
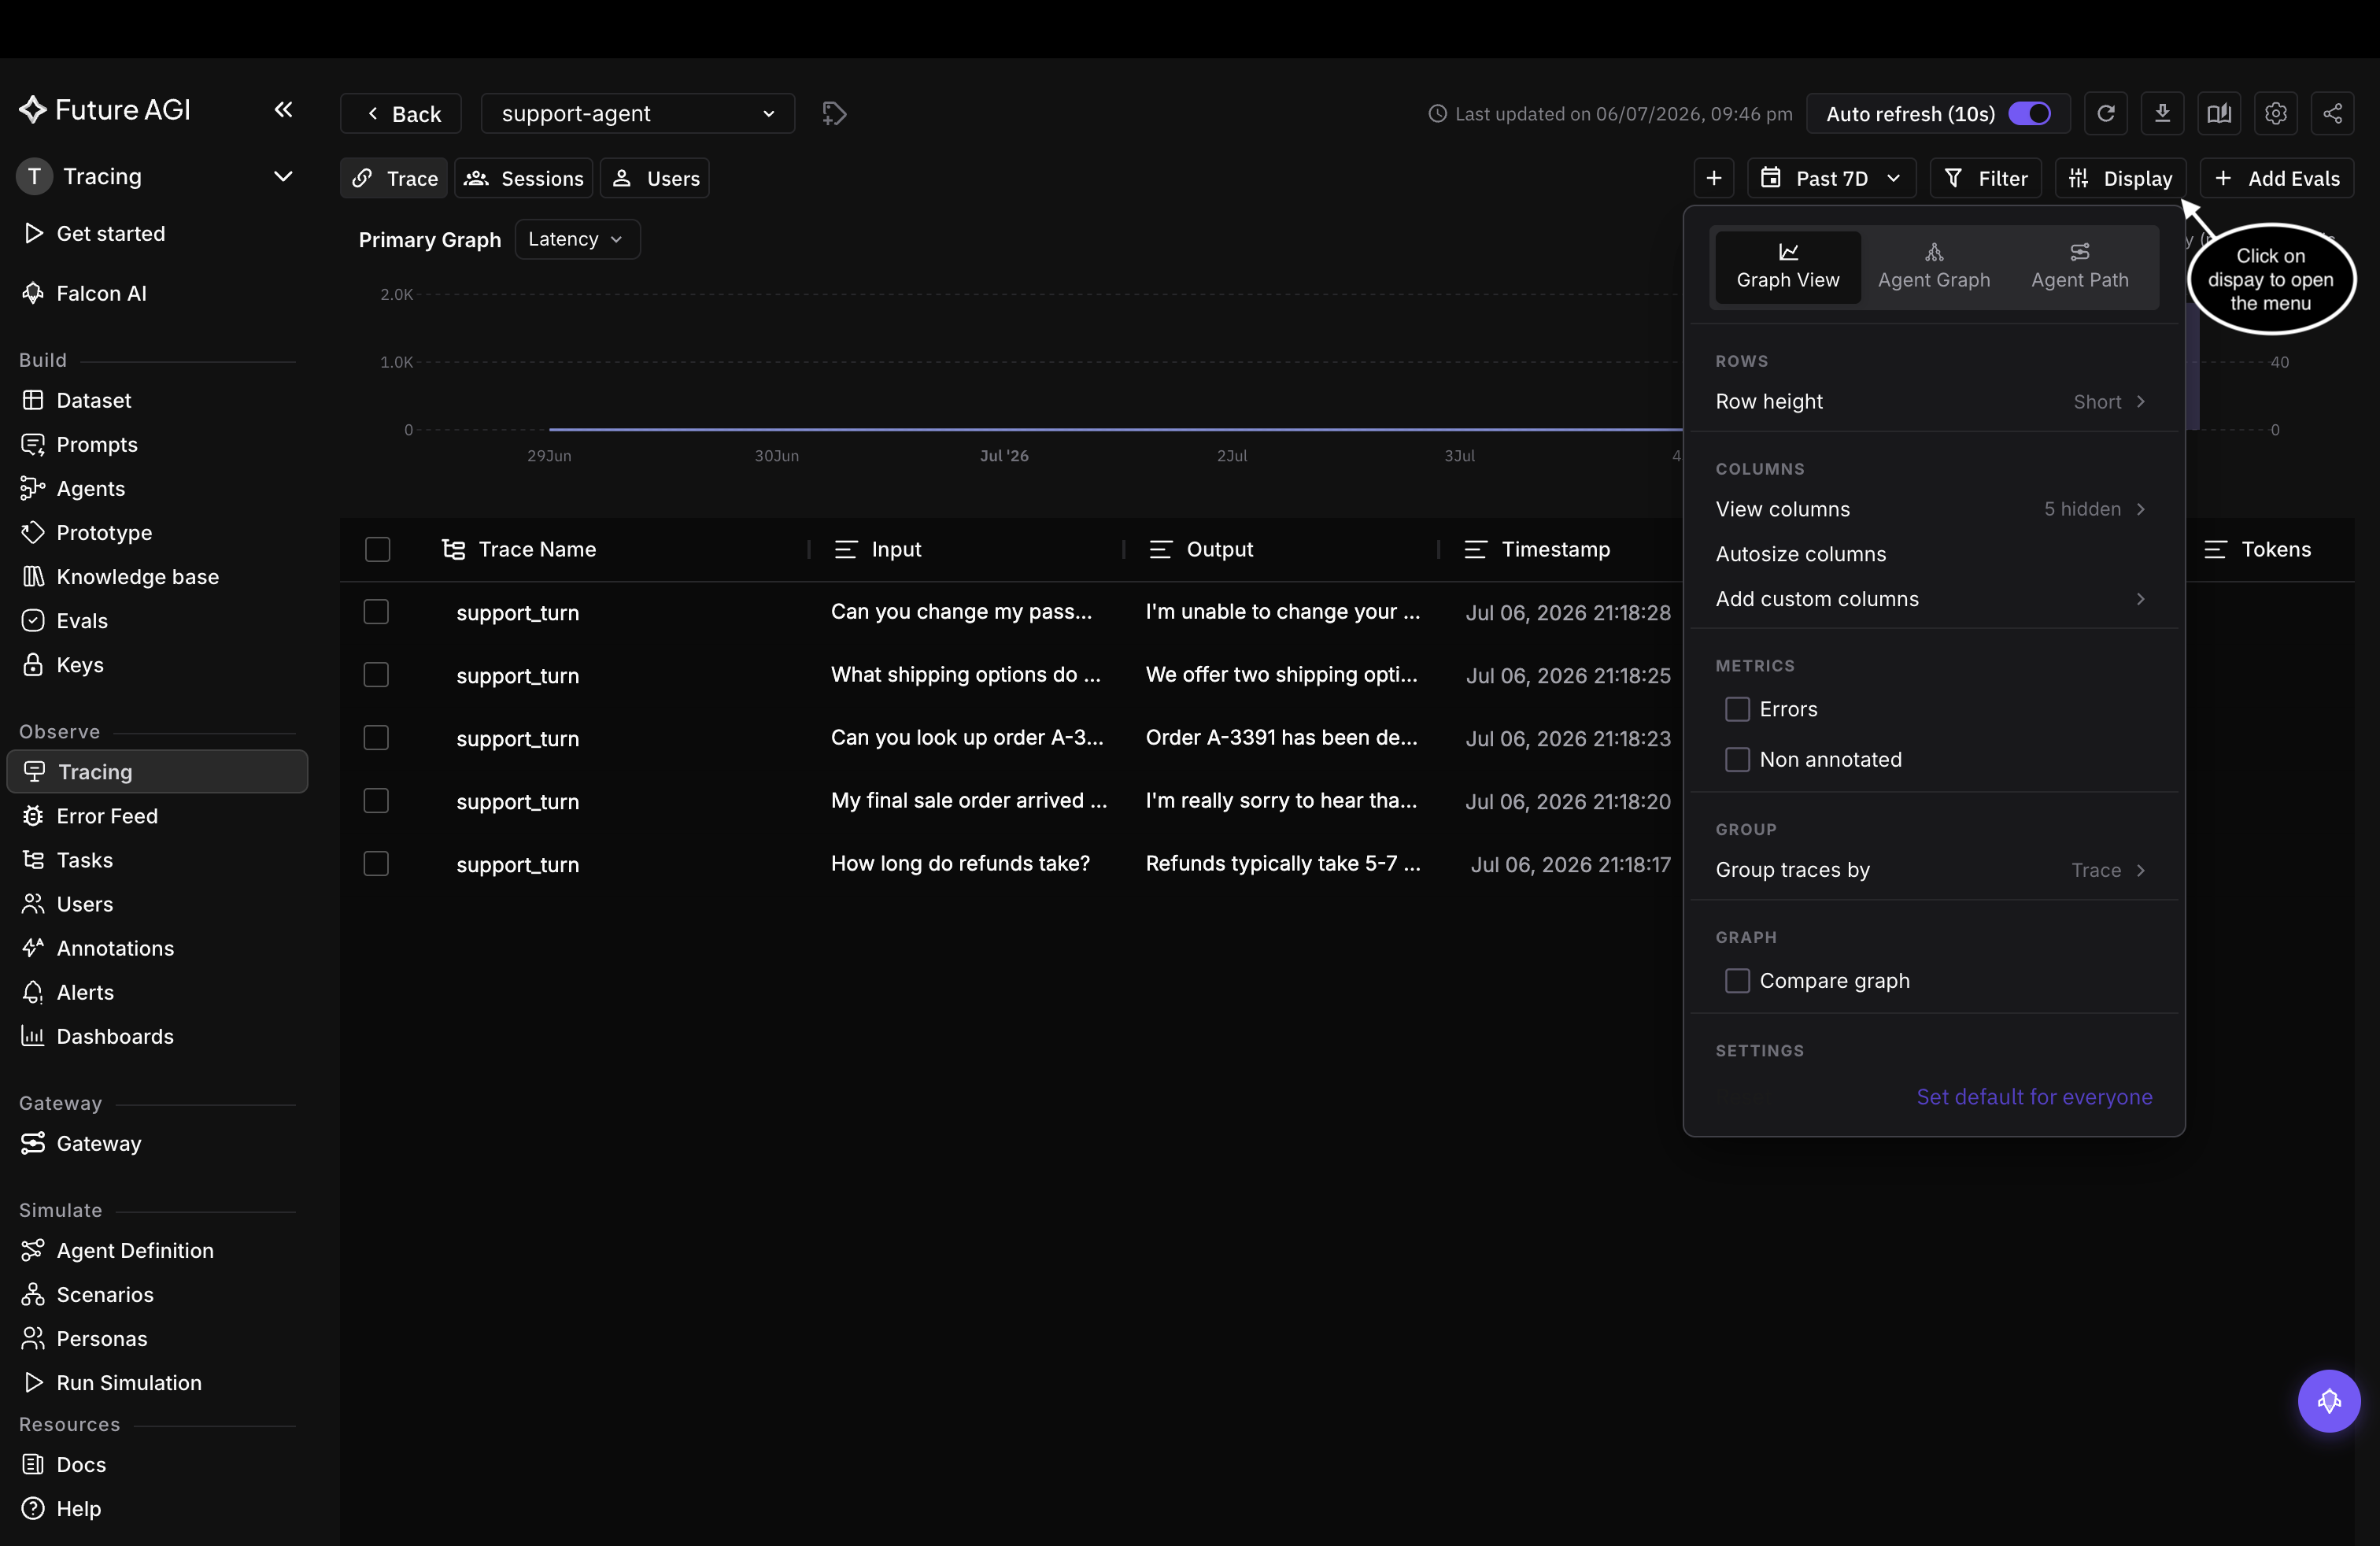
The Display menu: view switcher on top, then rows, columns, metrics, and grouping
Switch the primary view
The tabs at the top of the menu swap the graph above the table between three views of the same traces:
- Graph View: the default latency and traffic time series
- Agent Graph: your agent’s structure as a node graph
- Agent Path: span flow as a Sankey diagram, sized by span count
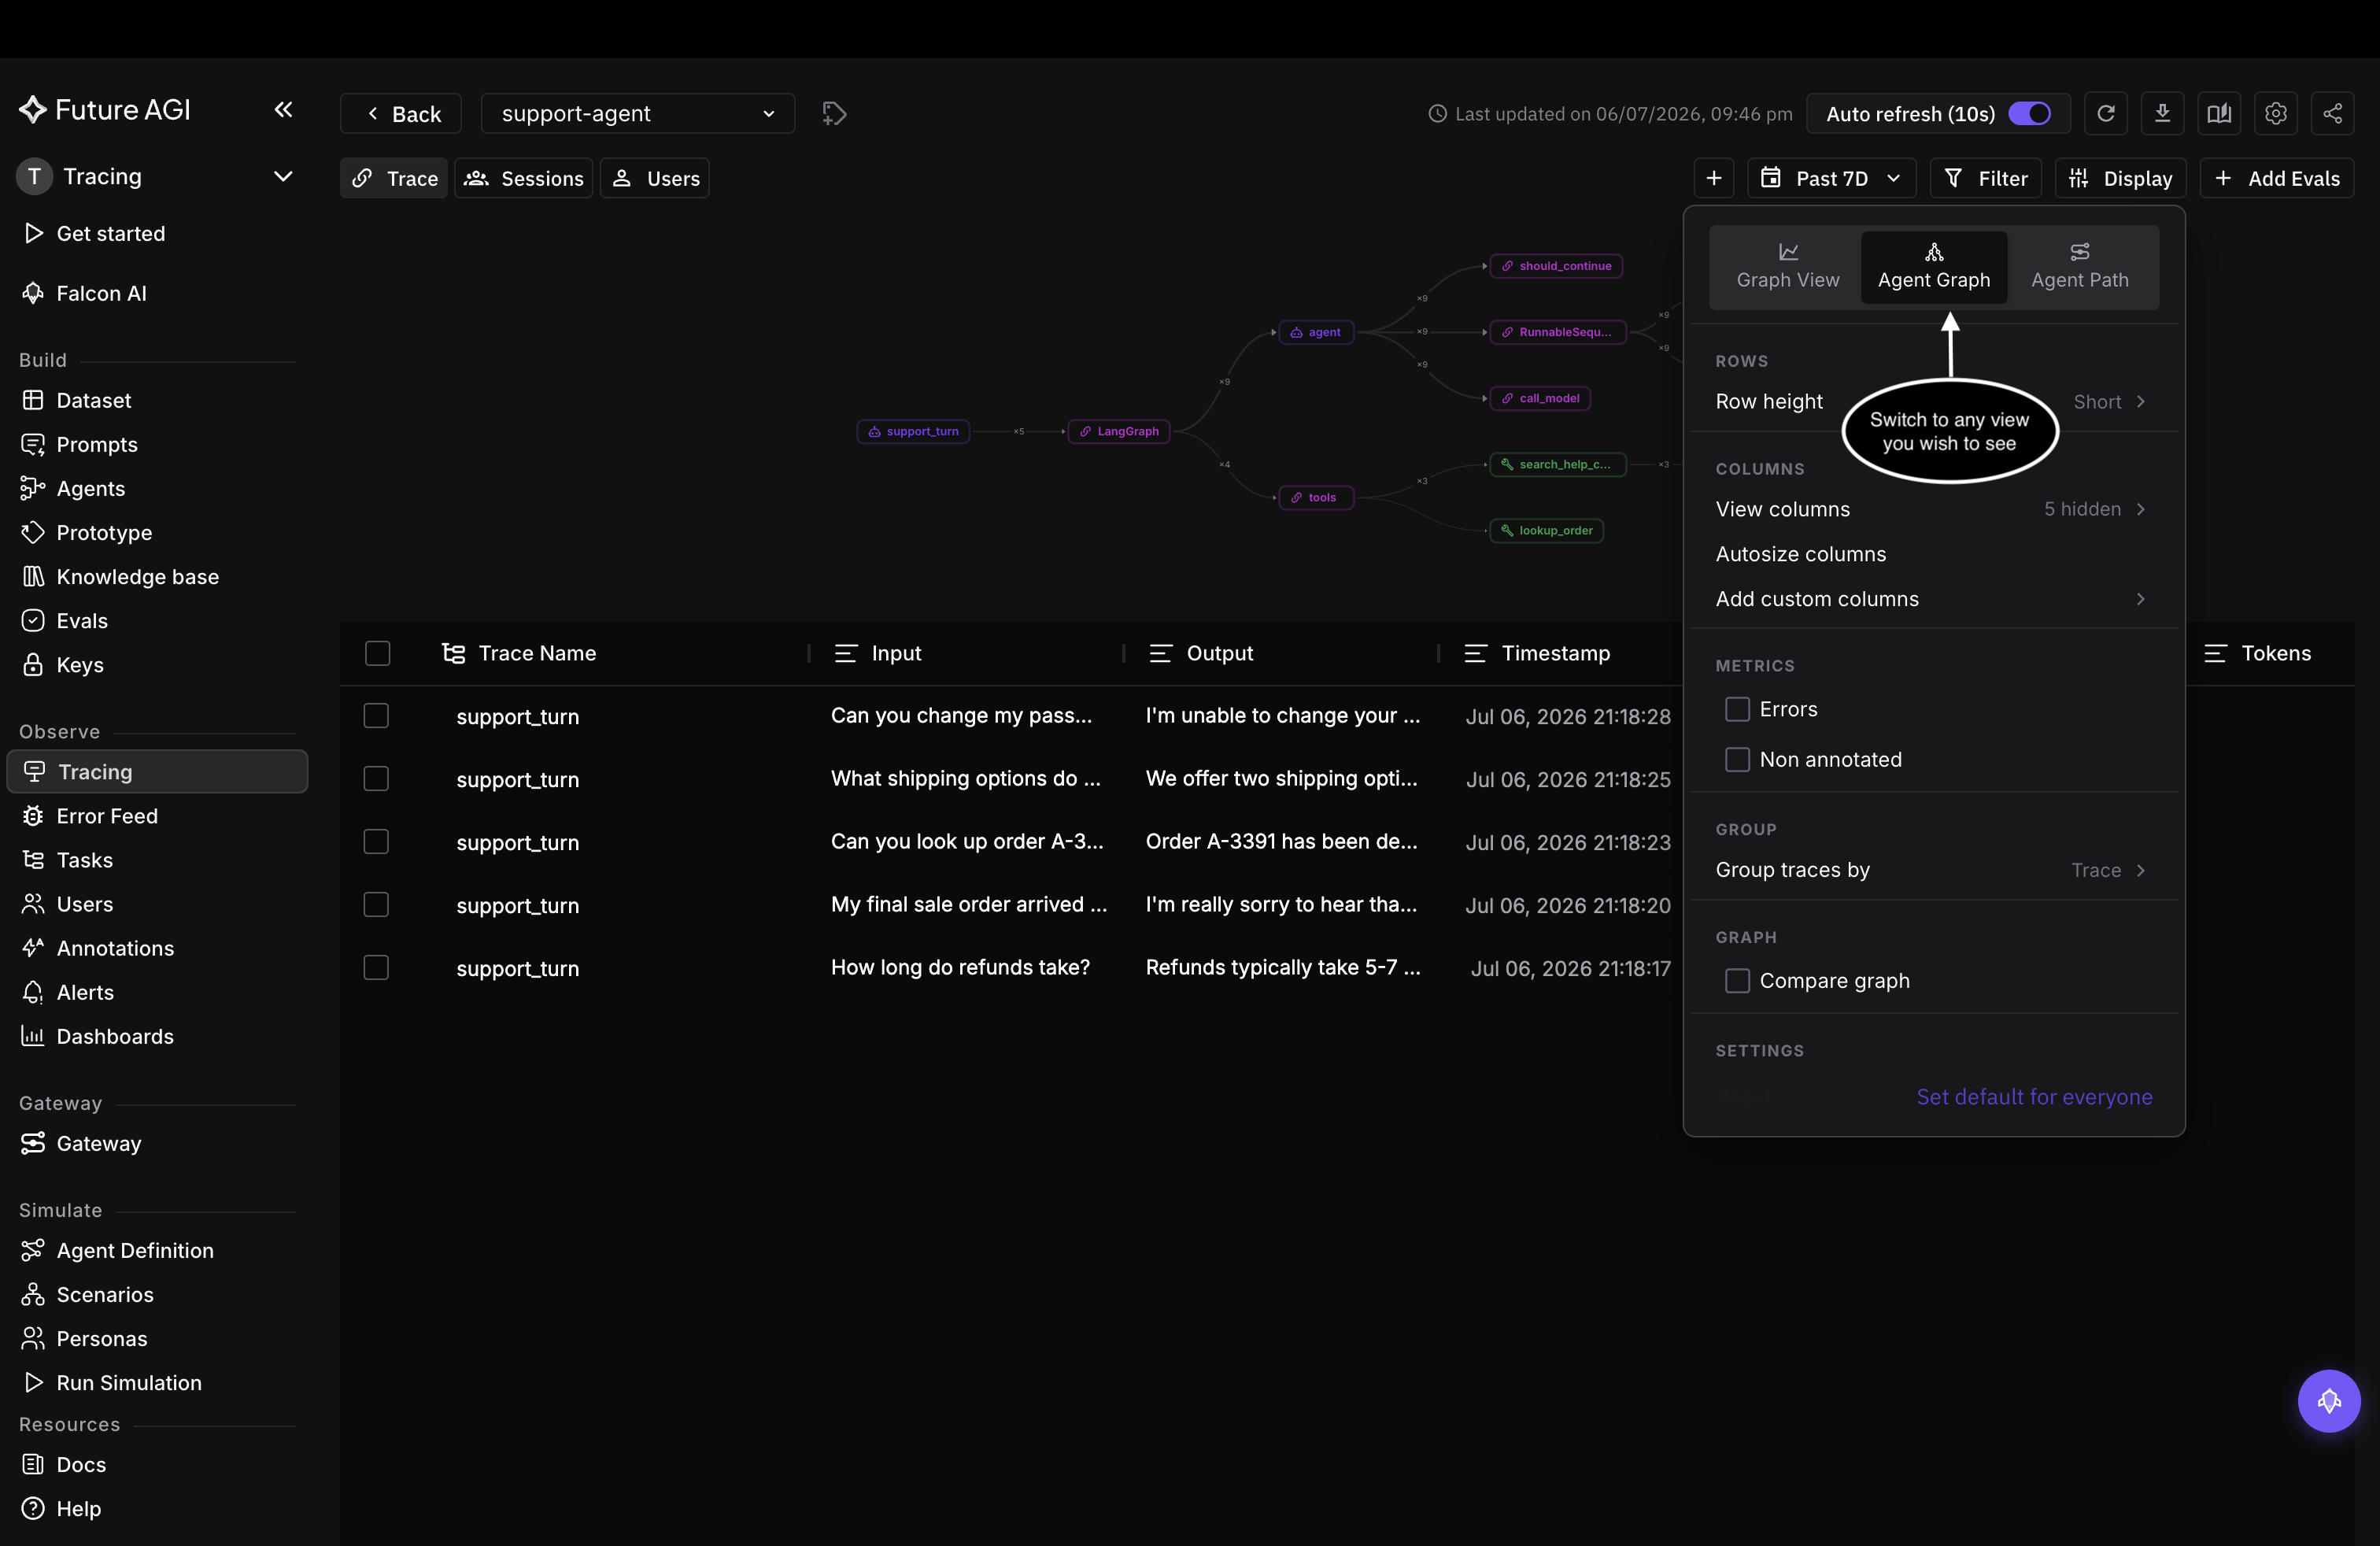
Switch views from the tabs at the top of the menu
Agent Graph draws the nodes the way your agent runs them: support_turn into the LangGraph nodes, the tools, and the LLM calls.
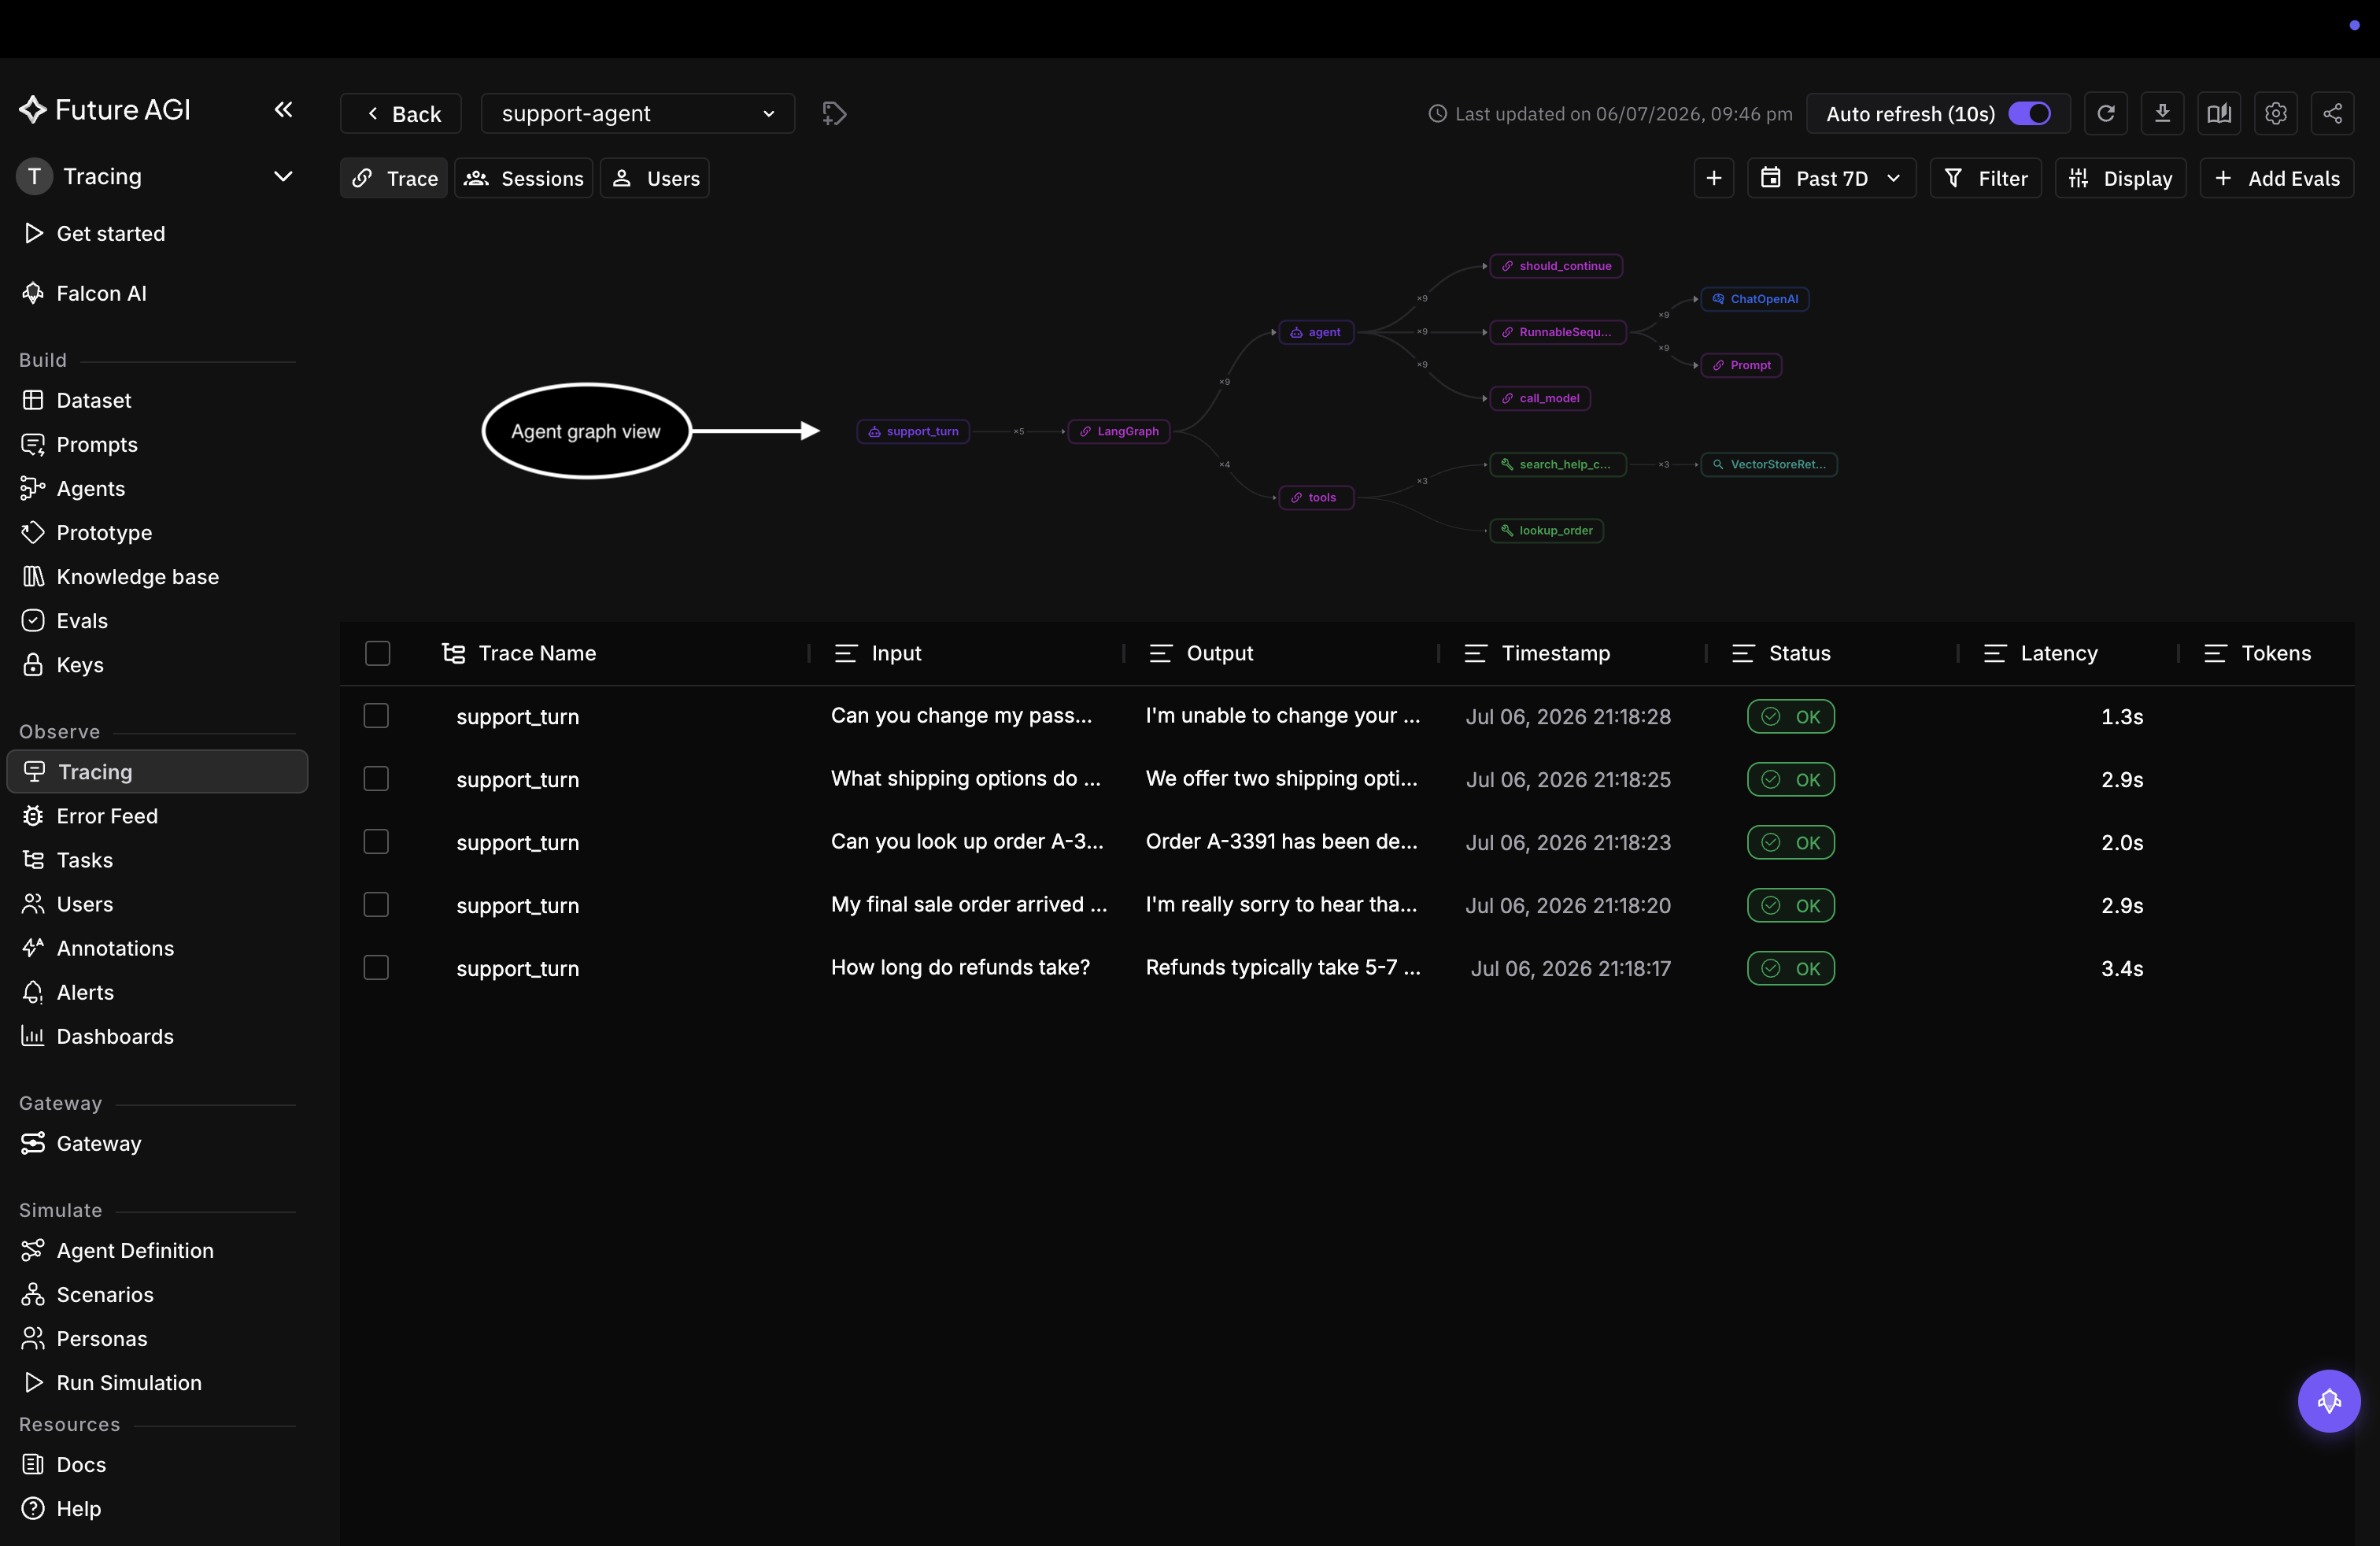
Agent Graph: the support agent’s structure as a node graph
Agent Path shows the same run as flow, with each node’s span count, so you can see where calls concentrate.
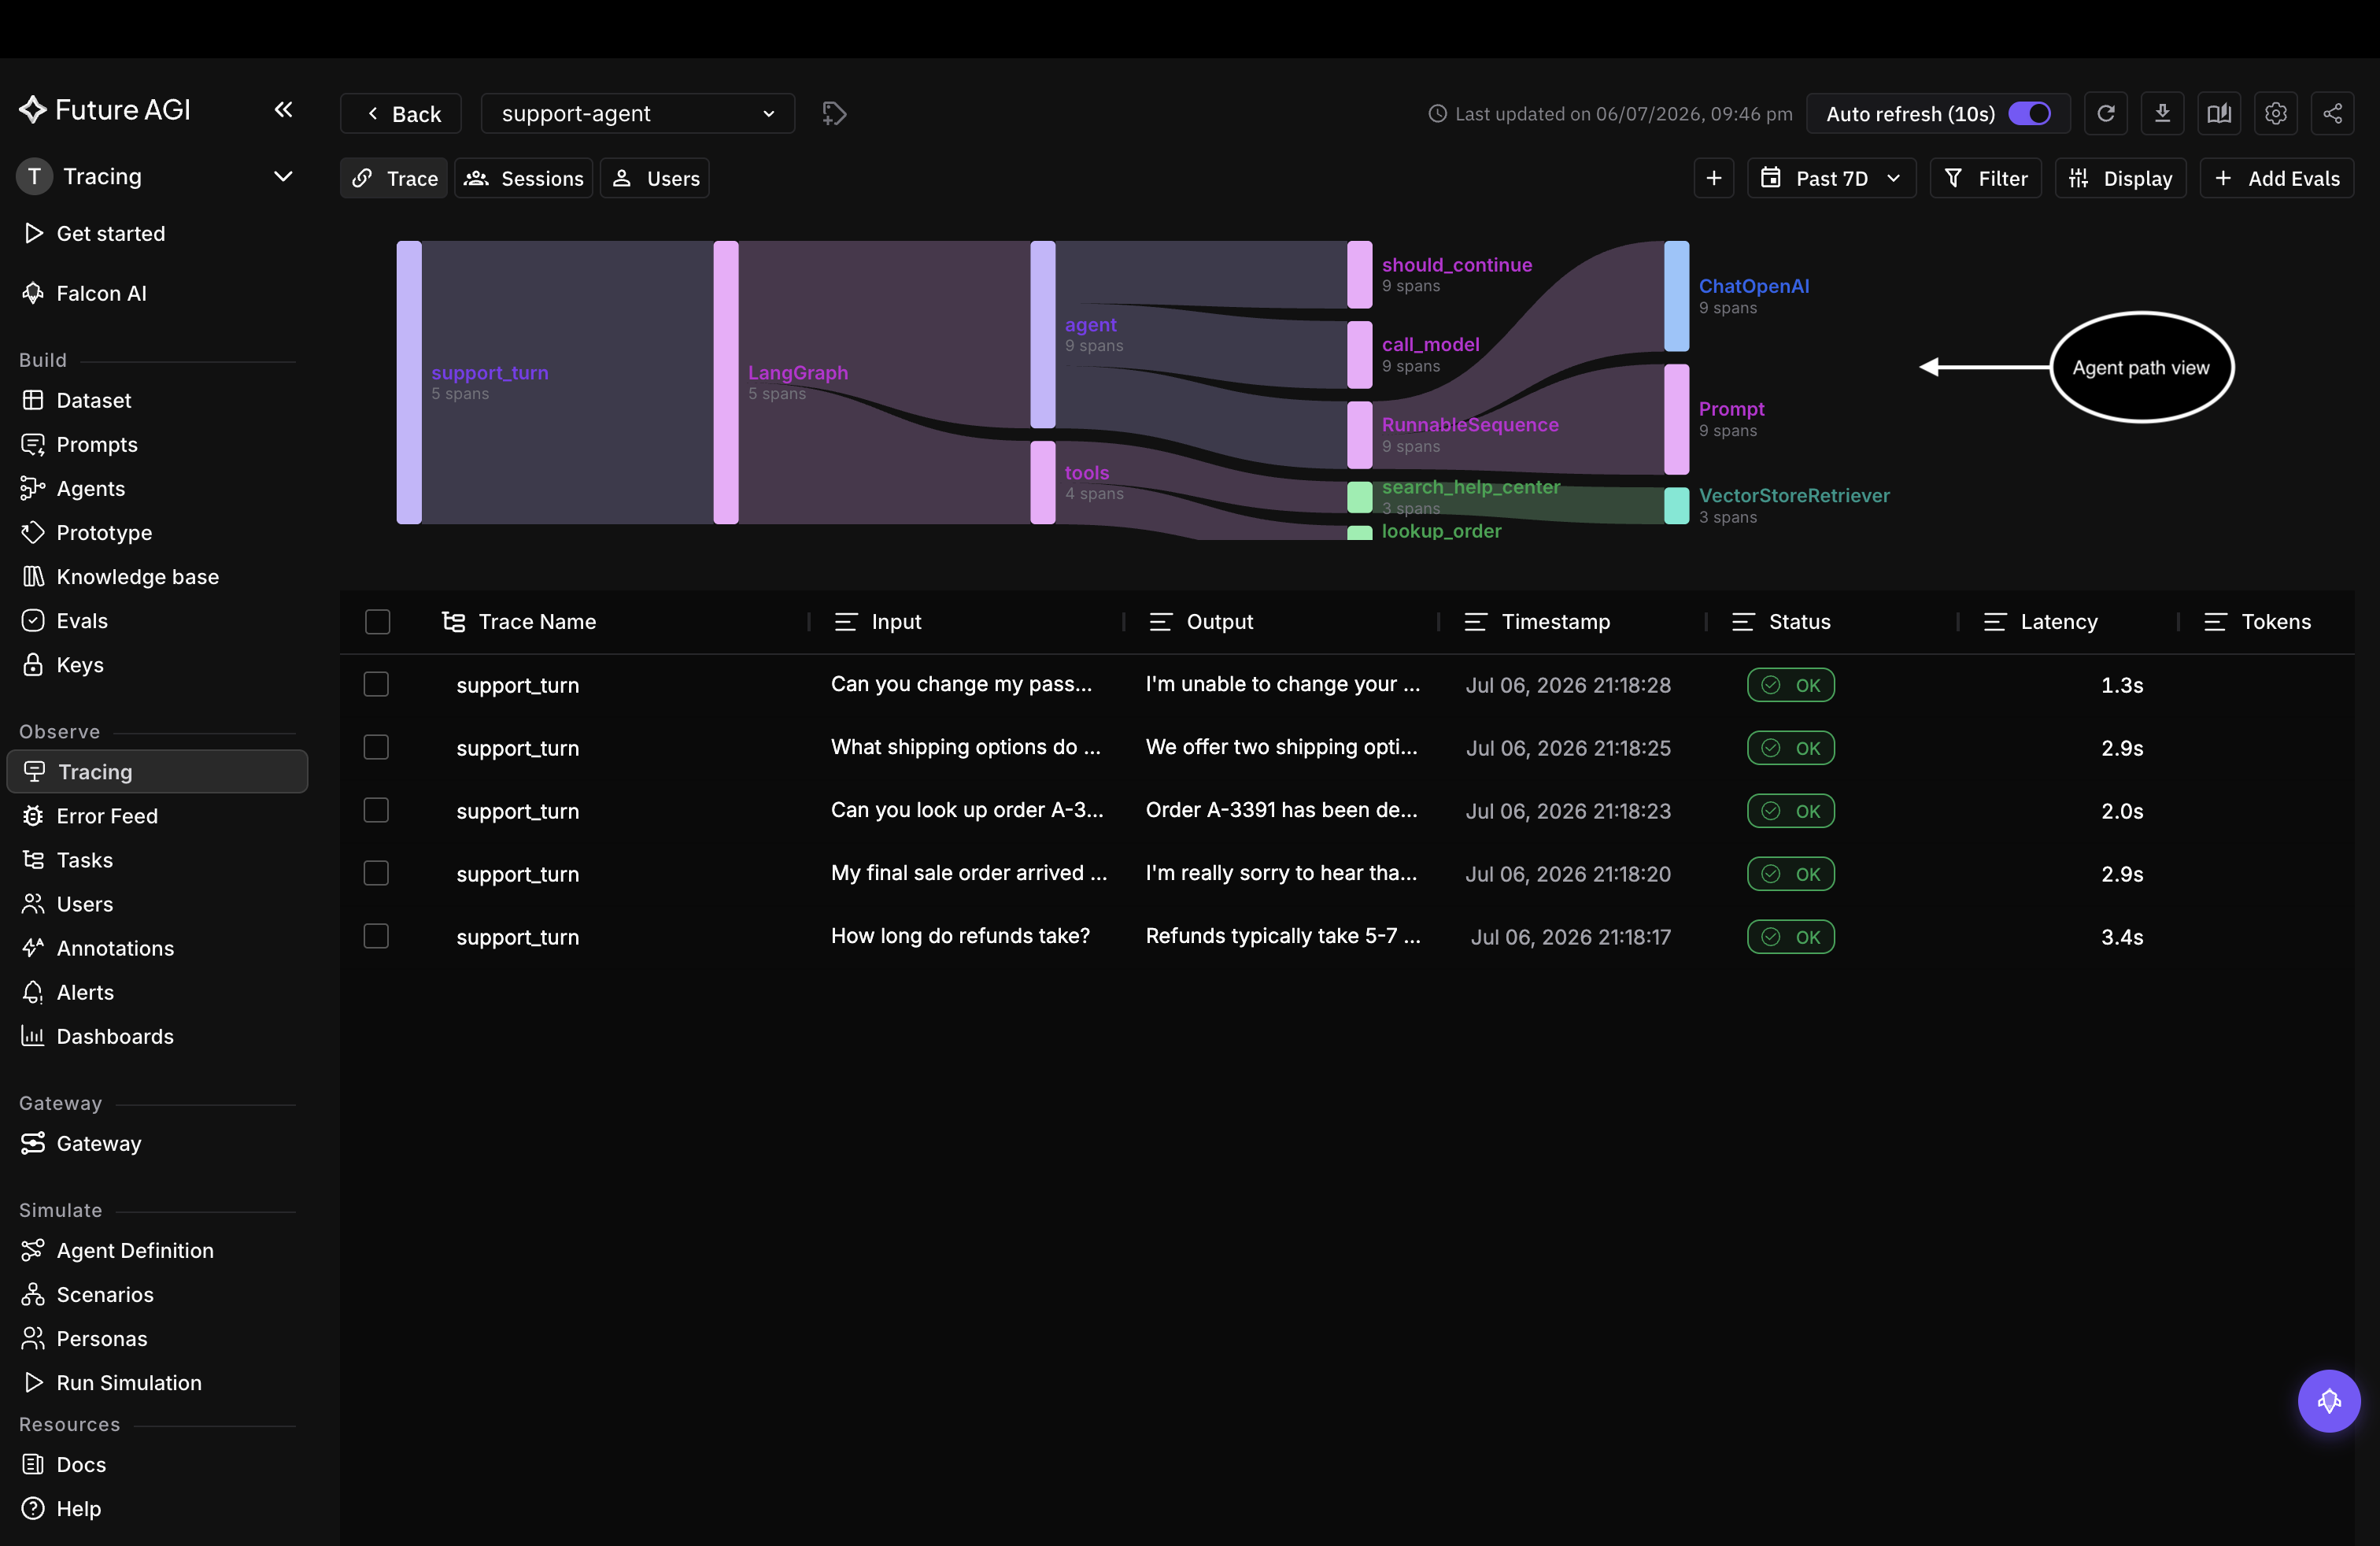
Agent Path: span flow sized by how many spans ran at each step
Choose your columns
Under Columns, View columns shows or hides any column, Autosize columns fits them to their content, and Add custom columns surfaces a span attribute as its own column. You can also reorder the columns so the fields you care about come first.
Reorder the columns so the fields you care about come first
Group the rows
Under Group, set Group traces by to collapse the table by trace or by span, so repeated spans fold into one group instead of filling separate rows.
Group traces by span to fold repeated spans into one row
Row height, metrics, and defaults
The rest of the menu tunes the table at a glance:
- Row height trades density for readability, from Short to taller rows
- Metrics (Errors, Non annotated) overlay counts so problem rows stand out
- Set default for everyone saves the current layout as your team’s default
To keep a layout for yourself alongside a filter, save it as a view.
Questions & Discussion