Export to Datadog: Forward Future AGI Logs and Metrics
Forward Agent Command Center logs and metrics from Future AGI to Datadog automatically for centralized monitoring and alerting.
Connect your Datadog account and Future AGI will push Agent Command Center request logs and aggregated metrics on every sync cycle. Logs land in Datadog Logs, metrics land in Datadog Metrics.
What this does
This integration exports your Agent Command Center traffic to Datadog. Every API call that flows through the gateway (model requests, cache hits, guardrail triggers, routing decisions) gets forwarded as a structured log with tags. Aggregated metrics (request counts, error rates, latency, token usage, cost) are sent alongside.
Once in Datadog, you can build dashboards, set up monitors, search logs, and alert on anomalies using data from your LLM gateway.
What gets exported
Logs
Each Agent Command Center request becomes a Datadog log entry with:
| Field | Example | Description |
|---|---|---|
message | [openai] gpt-4o status=200 latency=842ms tokens=1523 cost=$0.02 | One-line summary |
status | info or error | Based on whether the request errored |
attributes.model | gpt-4o | Model used |
attributes.provider | openai | Provider |
attributes.latency_ms | 842 | End-to-end latency |
attributes.input_tokens | 1200 | Prompt tokens |
attributes.output_tokens | 323 | Completion tokens |
attributes.cost | 0.02 | Cost in USD |
attributes.cache_hit | true | Whether the response was cached |
attributes.guardrail_triggered | false | Whether a guardrail fired |
Tags applied to every log: model, provider, status_code, gateway, error, cache, guardrail, routing. Use these for filtering and faceting in Datadog.
Metrics
Aggregated per sync interval under the agentcc.gateway.* namespace:
| Metric | Type | Description |
|---|---|---|
agentcc.gateway.requests | count | Total requests in the window |
agentcc.gateway.errors | count | Failed requests |
agentcc.gateway.latency_ms | gauge | Average latency |
agentcc.gateway.input_tokens | count | Total prompt tokens |
agentcc.gateway.output_tokens | count | Total completion tokens |
agentcc.gateway.cost | count | Total cost in USD |
Before you start
You’ll need:
- A Datadog account (any plan, including free tier)
- A Datadog API key, found in Datadog > Organization Settings > API Keys
- Optionally, an Application Key if you want Future AGI to create dashboard templates
- Admin or Owner role in your Future AGI workspace
- The Agent Command Center set up and receiving traffic
Note
Know which Datadog site/region your account is on (US1, US3, US5, EU1, AP1, or US1-FED). The integration needs this to send data to the right endpoint.
Connect Datadog
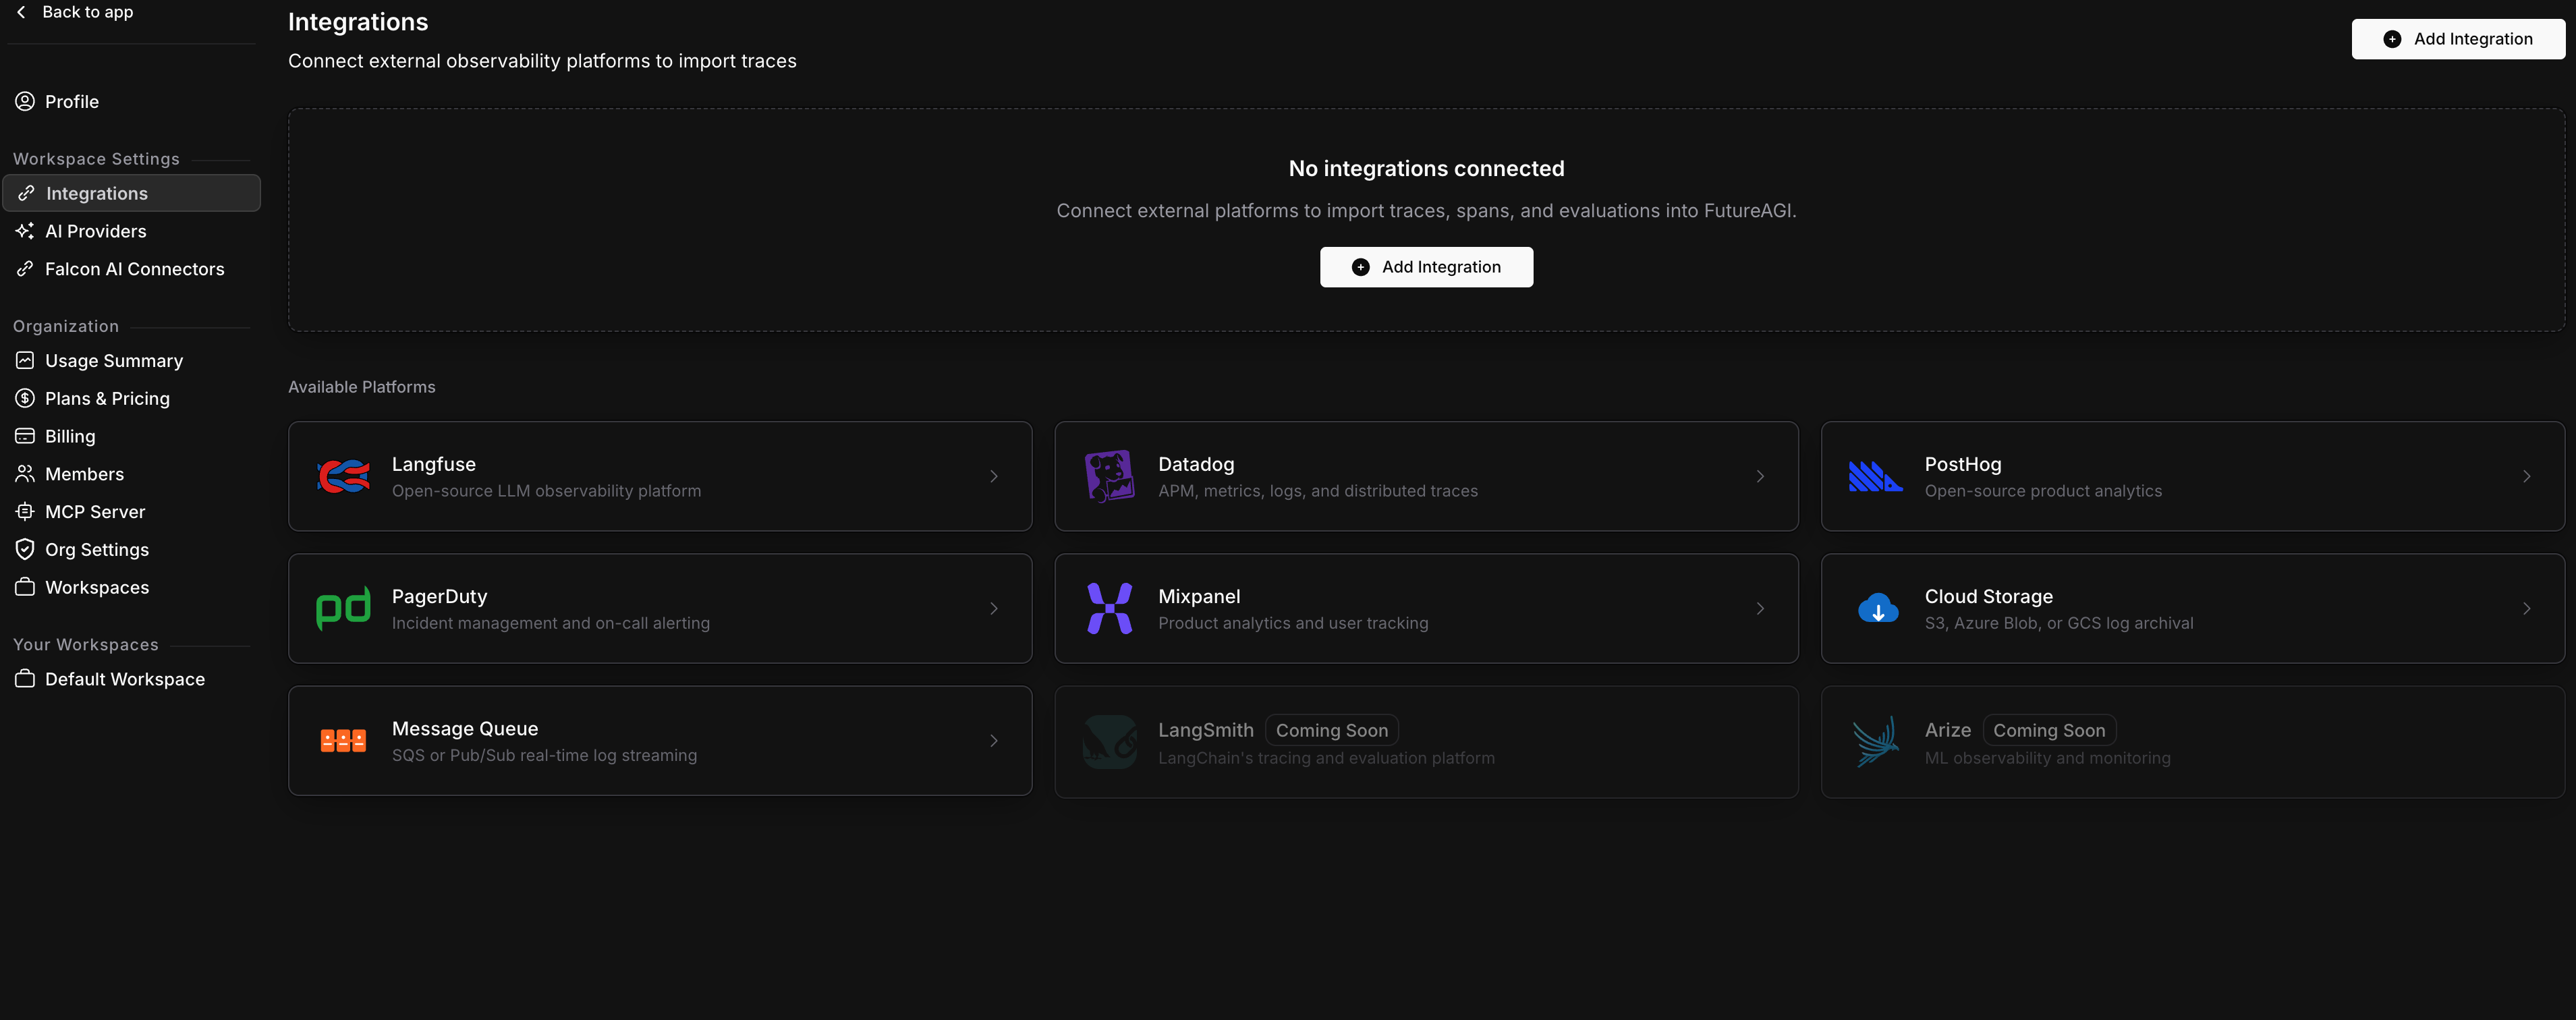
Open Integrations
Go to Settings > Integrations in your Future AGI workspace. Click Add Integration or click the Datadog card in the Available Platforms grid.
Enter your Datadog credentials
On the Credentials step, fill in:
| Field | Required | Description |
|---|---|---|
| Datadog Site | Yes | The region your Datadog account is in. Defaults to US1 (datadoghq.com). |
| API Key | Yes | Your Datadog API key. |
| Application Key | No | Needed only for dashboard template creation. |
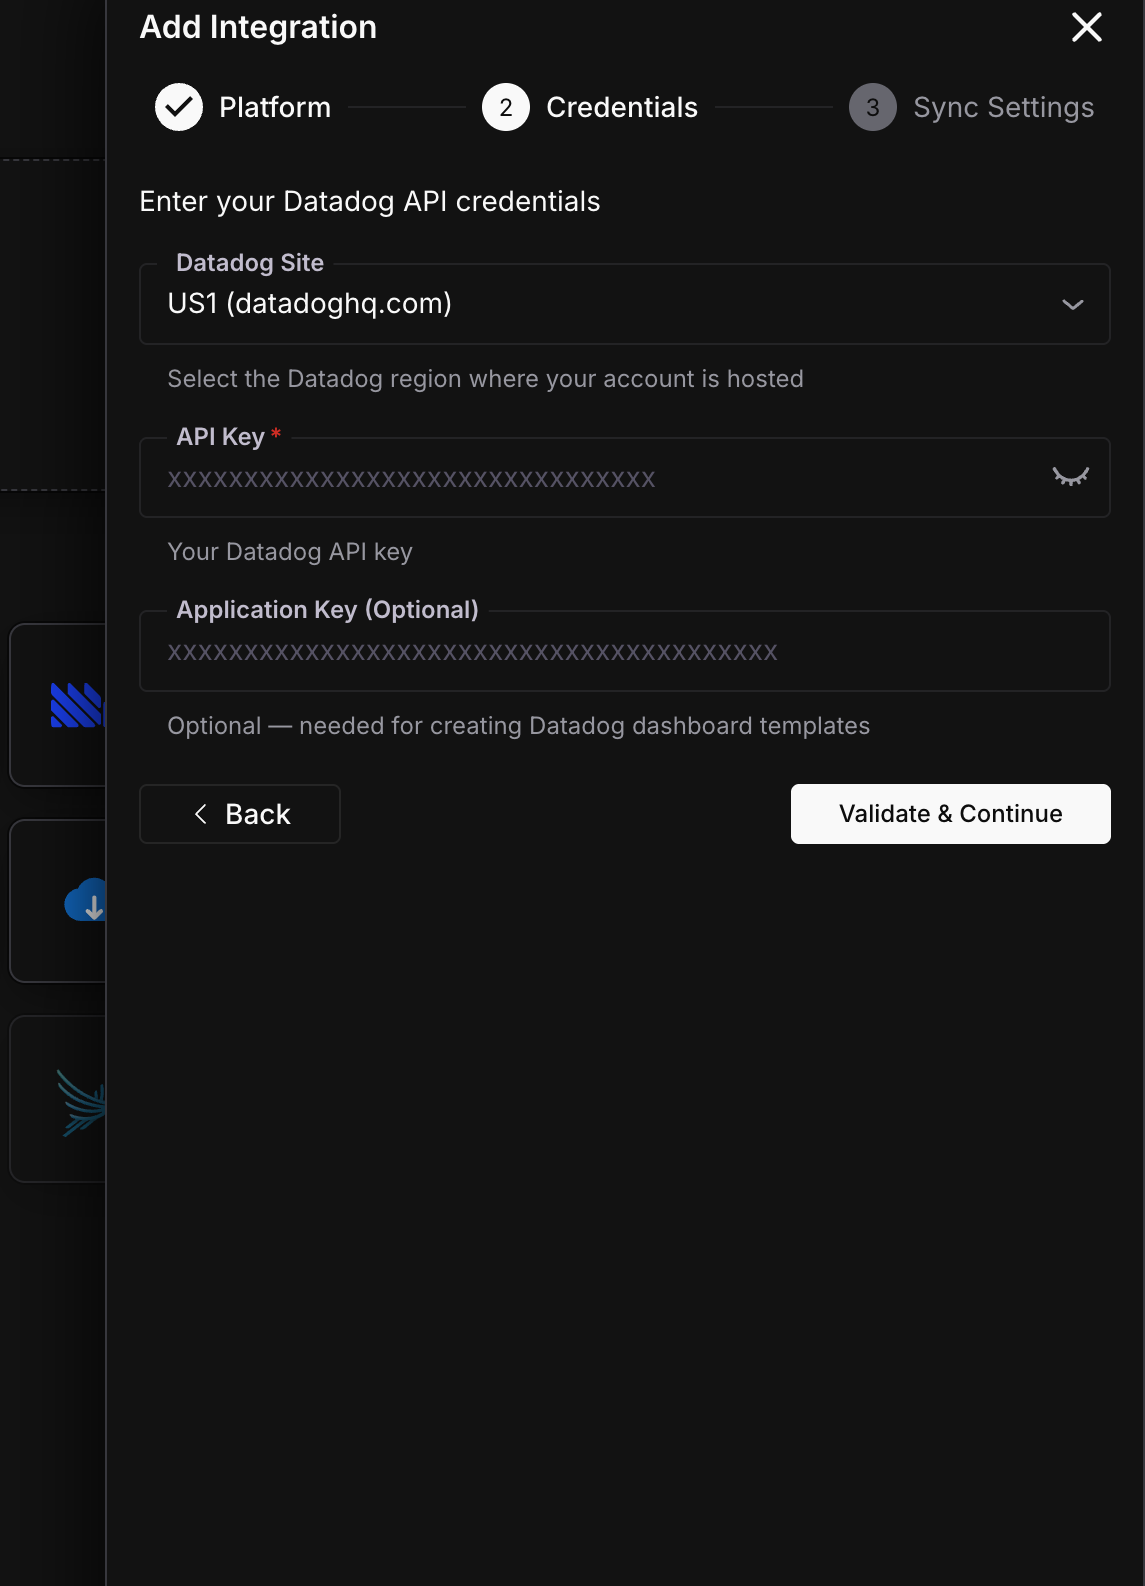
Click Validate & Continue.
Configure sync settings
Set the sync interval and historical data option.
Sync Interval controls how often Future AGI batches and sends data to Datadog. Every 5 minutes works for most setups. Use 1-2 minutes if you need near real-time visibility.
Historical Data lets you backfill past gateway logs into Datadog, or start fresh with only new traffic going forward.
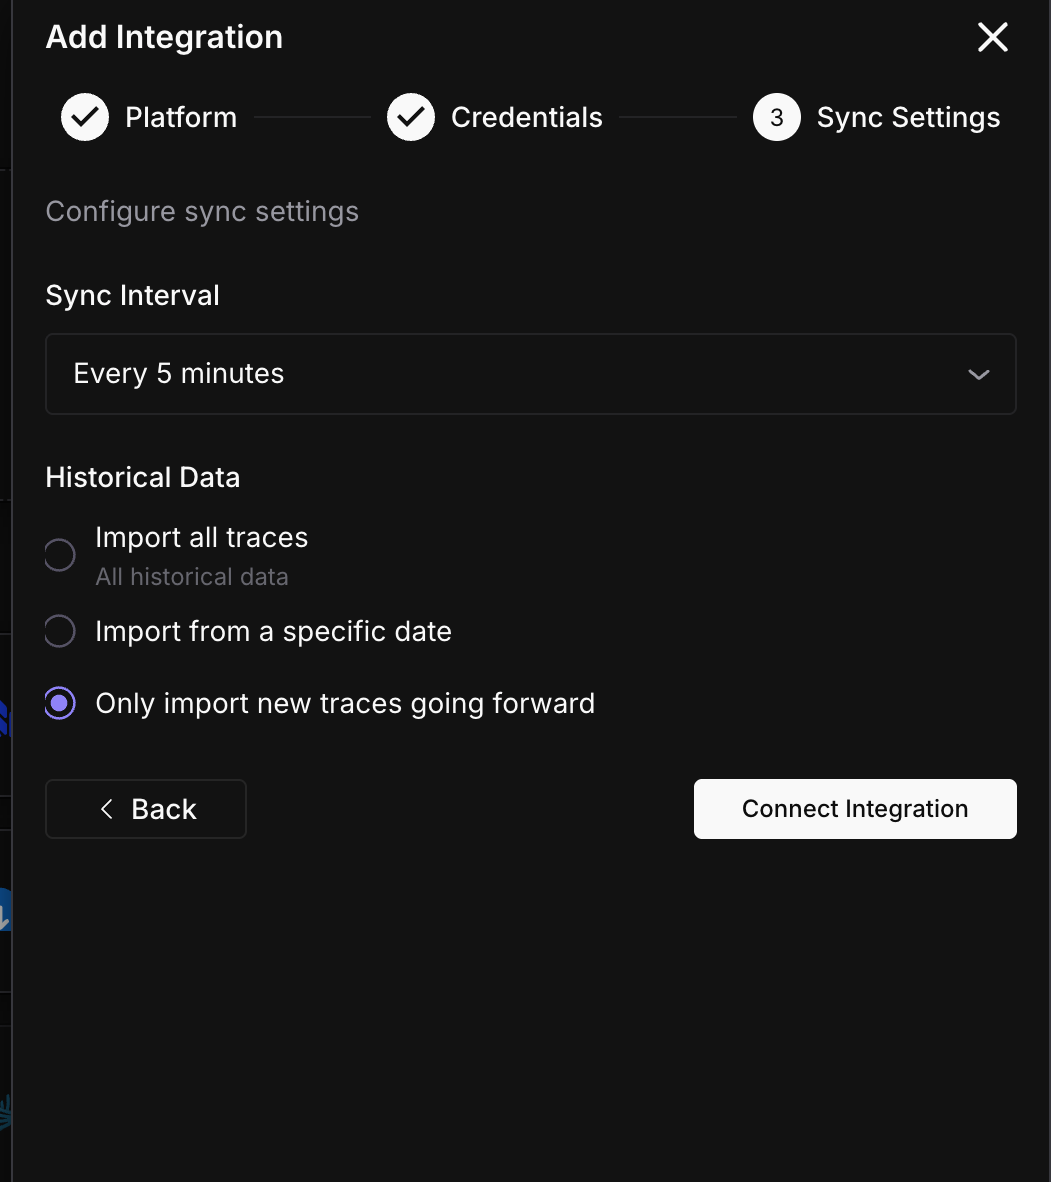
Click Connect Integration.
Done
Data starts flowing to Datadog on the next sync cycle. Head to Datadog to verify.
Verify in Datadog
Once the first sync completes:
- Logs: Go to Datadog > Logs and search for
source:futureagior filter by tags likemodel:gpt-4o - Metrics: Go to Datadog > Metrics Explorer and search for
agentcc.gateway.requests
If nothing shows up after 10 minutes, check the sync status in Settings > Integrations and look at the sync history for errors.
Sync status
Monitor your integration from the detail page (Settings > Integrations > click your Datadog connection).
| Status | Meaning | Action |
|---|---|---|
| Active | Exporting on schedule | None needed |
| Syncing | A batch is being sent right now | Wait for it to finish |
| Paused | You paused the export manually | Click Resume when ready |
| Error | API key revoked or Datadog rejected the request | Check your API key and Datadog site region |
Troubleshooting
No logs appearing in Datadog
Check that you selected the correct Datadog site/region. US1 (datadoghq.com) is the default, but if your account is on EU1 (datadoghq.eu) or another region, logs are being sent to the wrong endpoint. Edit the integration and change the site.
Logs appear but metrics are missing
Metrics are only sent when there’s at least one request in the sync window. If your gateway had no traffic during a cycle, no metrics are emitted. Check that the Agent Command Center is actively receiving requests.
Connection shows Error status
This usually means your Datadog API key was revoked or is invalid. Generate a new API key in Datadog > Organization Settings > API Keys, then edit the integration to update it.
High latency or delayed data
Logs are sent in batches of 500. If your gateway handles thousands of requests per minute, the sync cycle takes longer to complete. This is normal for high-volume setups. If the delay is a problem, increase the sync interval so each cycle covers a shorter window.
What’s next
Questions & Discussion