Usage & analytics
See how an eval has performed over time, and dig into any single run
The Usage tab on an eval’s page shows how the eval has performed over time, and lets you open any single run. A summary and chart sit at the top, and the full evaluation log runs below.
Open the eval
From the Evaluations list, open the eval you want to inspect and switch to its Usage tab.
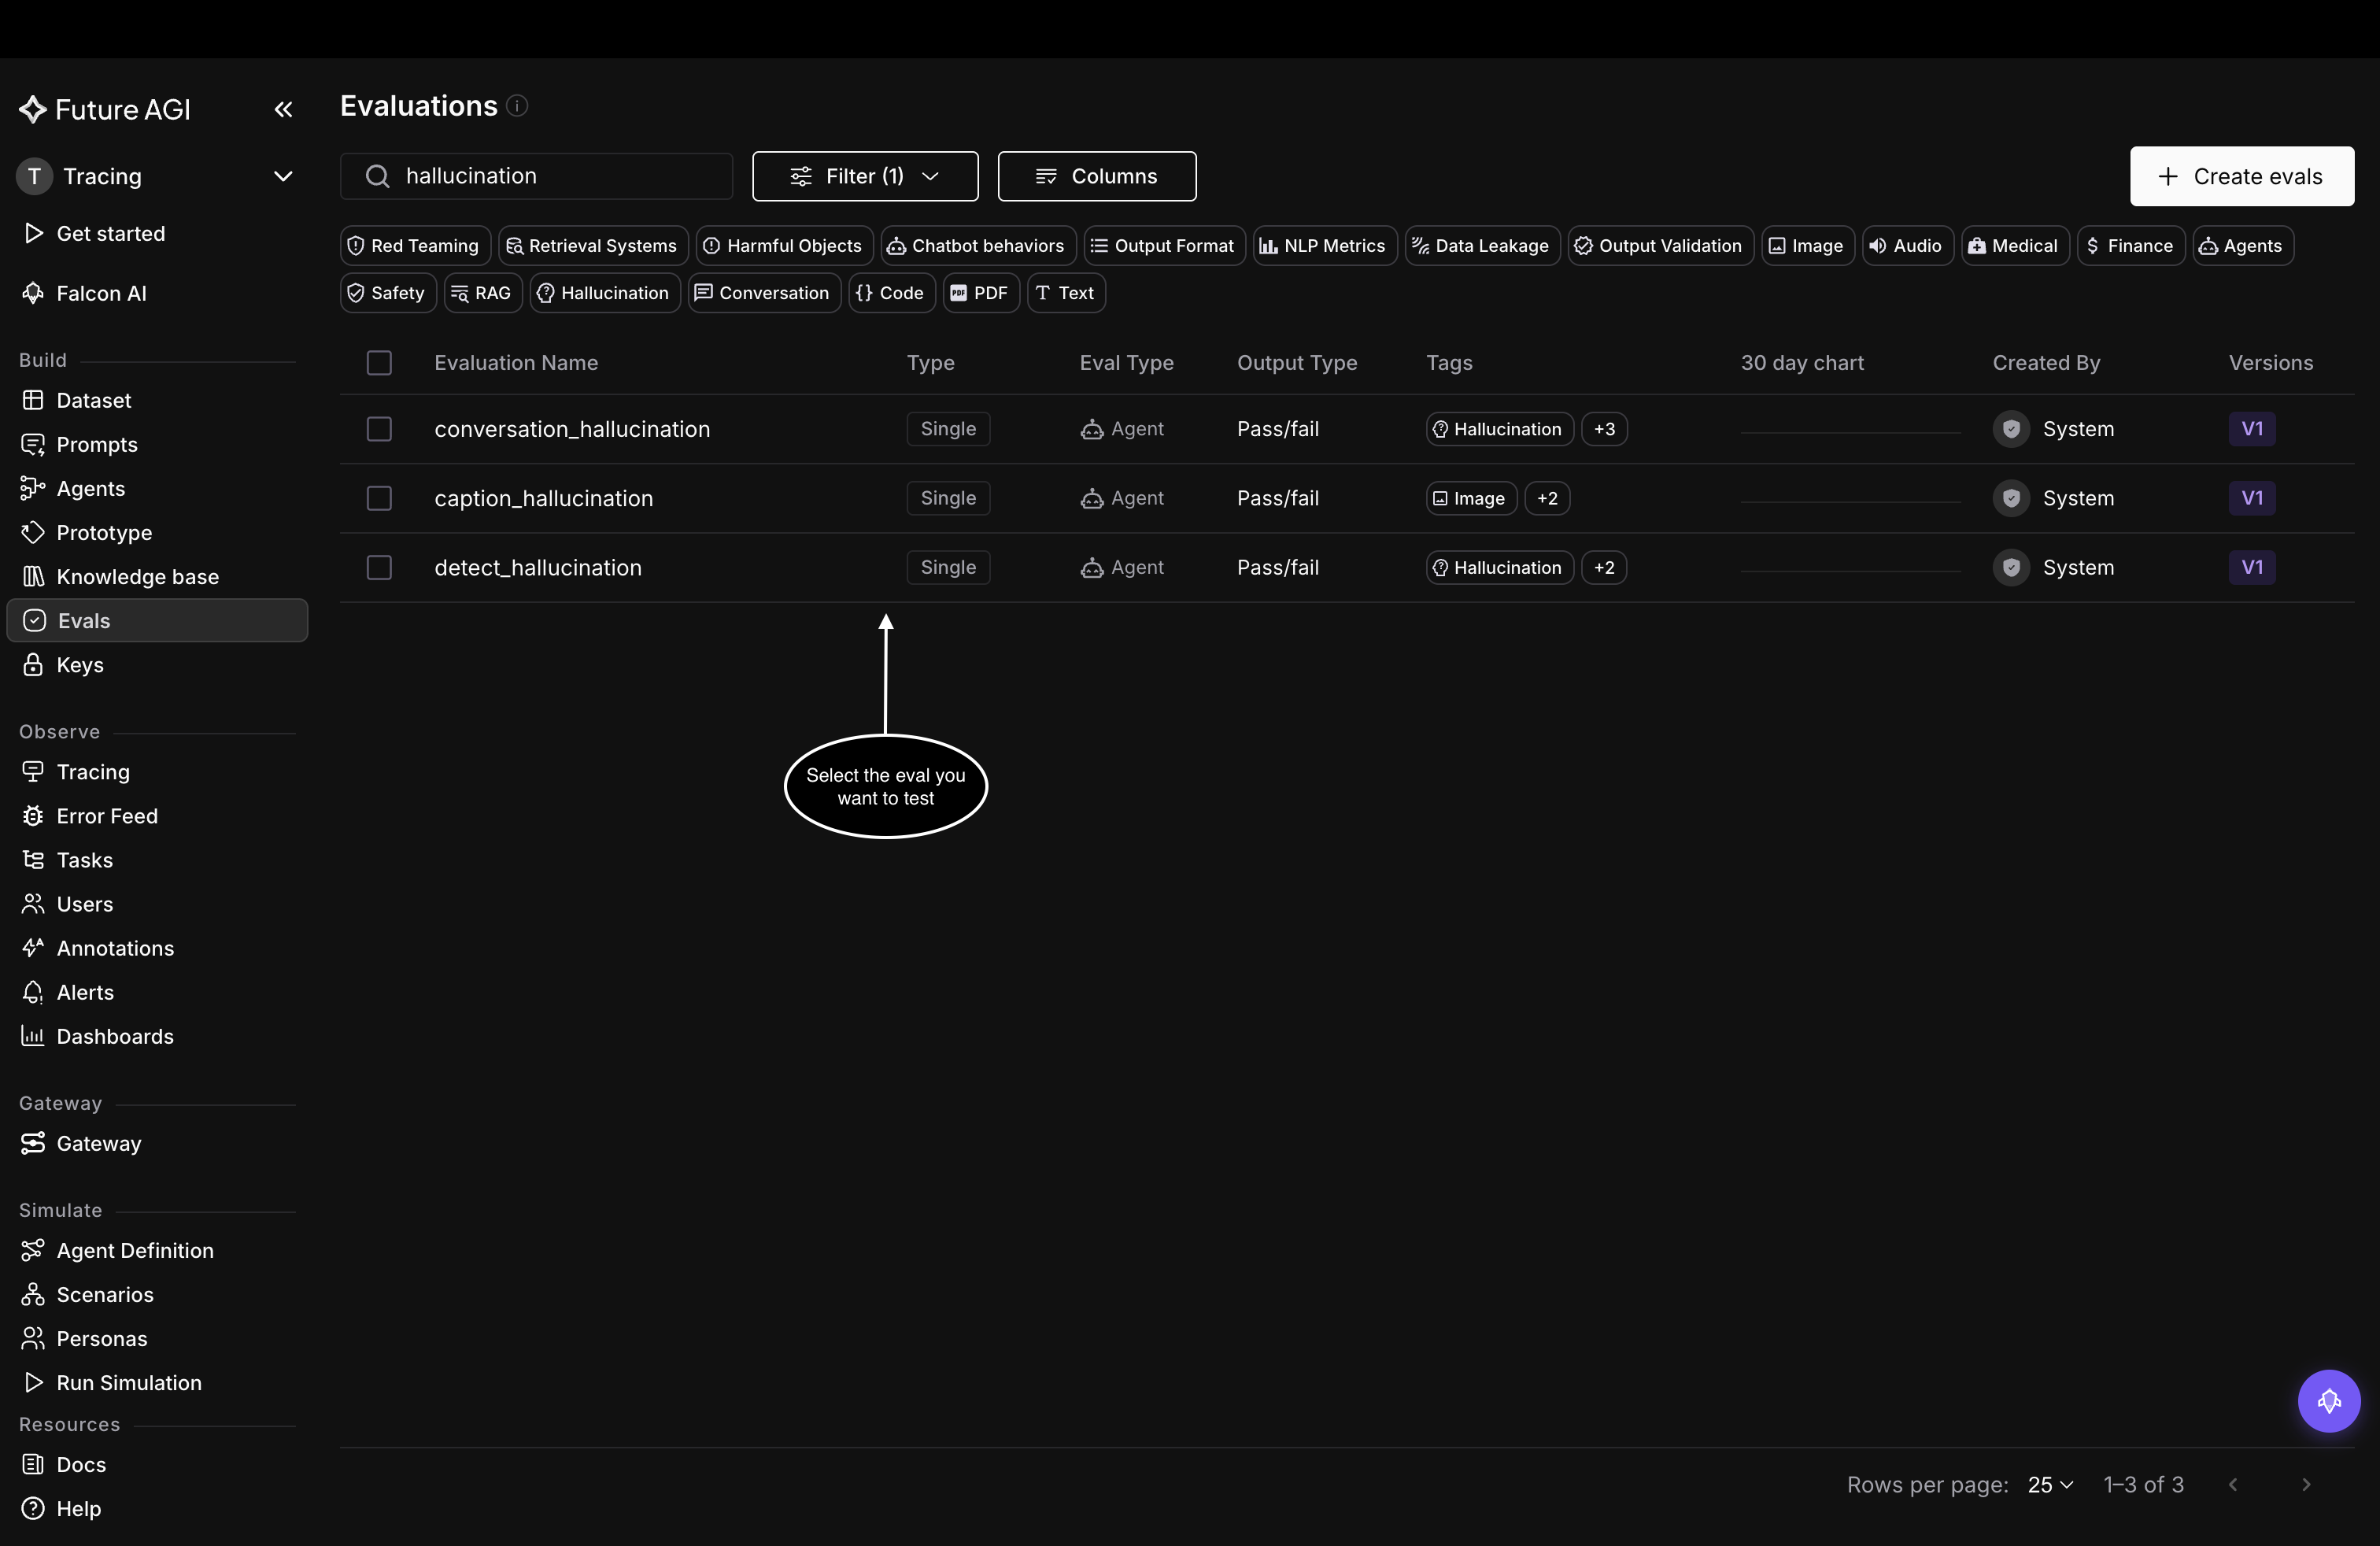
From the Evaluations list, open an eval to reach its Usage tab
Pick a time range
A row of ranges at the top scopes everything below it: 30 mins, 6 hrs, Today, Yesterday, 7D, 30D, 3M, 6M, and 12M, or Custom for your own dates. Narrow it to a spike you are investigating, or widen it to watch the long trend.
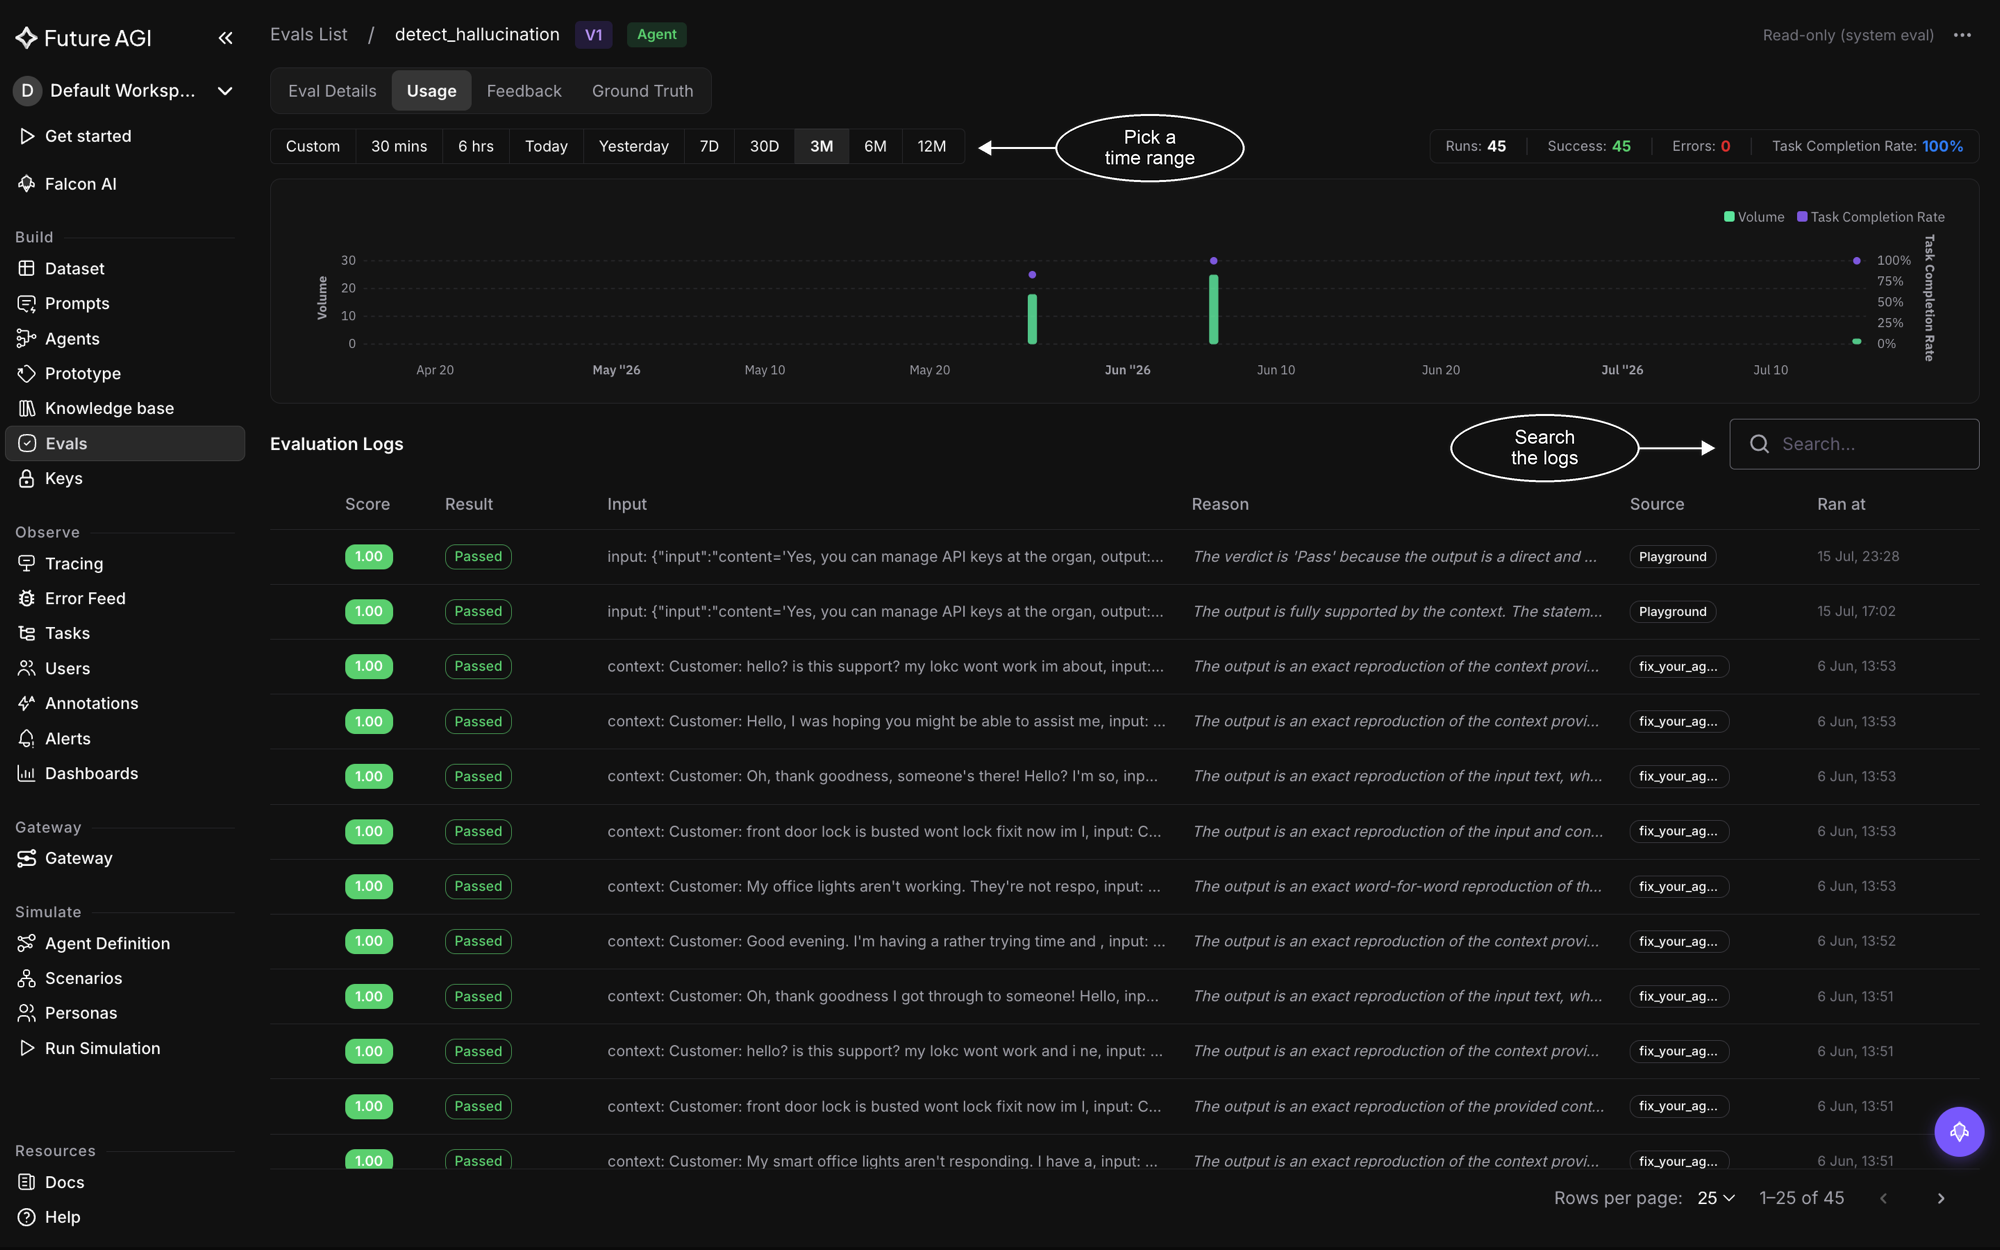
The Usage tab: pick a time range, read the summary and chart, then dig into any run in the evaluation logs
The summary and chart
For the chosen range you get the headline numbers, Runs, Success, Errors, and Task Completion Rate, alongside a chart that plots Volume, how many runs, against the Task Completion Rate over time. A rate that dips or a volume that drops is your cue to look closer.
Evaluation logs
Below the chart, Evaluation Logs lists every run the eval scored, one row each: its Score and Result (passed or failed), the Input it saw, the Reason for the verdict, the Source it ran under (Playground, Dataset, or Tracer, or the name of the project), and when it Ran. Use the Search box to find a run by a free-text match across its id, input, result, and reason.
Dive deeper
Questions & Discussion