Falcon AI Trace Debugging
Falcon AI auto-attaches the failing trace you're viewing, so you can debug it conversationally and get a paste-ready prompt fix without copy-pasting trace IDs.
Instrument an agent, open Falcon AI on its failing trace, and drive a three-turn conversation that ends in a paste-ready prompt fix, without copying a trace ID or leaving the dashboard.


| Time | Difficulty | Package |
|---|---|---|
| 10 min | Beginner | fi-instrumentation-otel |
- Future AGI account → app.futureagi.com
- API keys:
FI_API_KEYandFI_SECRET_KEY(see Get your API keys) - OpenAI API key →
OPENAI_API_KEY - Python 3.11
- A traced project on the platform with at least one failing trace. If you don’t have one, instrument any agent with the first step below and let it run a query that exposes a failure.
Install
Install the Future AGI instrumentation SDK and set your API keys.
pip install fi-instrumentation-otel traceai-openai openaiexport FI_API_KEY="your-fi-api-key"
export FI_SECRET_KEY="your-fi-secret-key"
export OPENAI_API_KEY="your-openai-key"Tutorial
Falcon AI is the AI assistant built into the Future AGI dashboard. Open it from the sidebar and it picks up whatever page you’re viewing as context, so questions are answered against the trace, project, or dataset you’re already on. It runs skills: slash commands that execute a structured workflow over the current context and produce a clickable artifact (a dataset, an eval run, a prompt diff).
Add tracing to your agent
Falcon AI does its work by reading your agent’s traces: a trace is the structured record of one request, broken into spans for each LLM call, tool invocation, or sub-step inside it. The agent has to be sending traces to Future AGI before any of the next steps can run.
Three lines below set that up. OpenAIInstrumentor patches the OpenAI SDK so every API call is captured automatically. The @tracer.agent decorator on your agent’s entry point makes each request appear as one parent span with the OpenAI calls nested underneath.
from fi_instrumentation import register, FITracer
from fi_instrumentation.fi_types import ProjectType
from traceai_openai import OpenAIInstrumentor

trace_provider = register(
    project_type=ProjectType.OBSERVE,
    project_name="research-assistant-demo",
)
OpenAIInstrumentor().instrument(tracer_provider=trace_provider)
tracer = FITracer(trace_provider.get_tracer("research-assistant-demo"))
from openai import OpenAI
client = OpenAI()
# Replace this with your own agent's entry point.
# The @tracer.agent decorator makes each call show up as one parent span
# in your Future AGI Tracing project, with the OpenAI calls nested underneath.
@tracer.agent(name="my_agent")
def my_agent(user_message: str) -> str:
response = client.chat.completions.create(
model="gpt-4o-mini",
messages=[
{"role": "system", "content": "You are a research assistant. Provide citations to support your claims."},
{"role": "user", "content": user_message},
],
)
return response.choices[0].message.content
# Asking for citations on a topic the model has no search tool for is a
# common failure mode (the model fabricates papers from training data).
# This gives Falcon AI a failing trace to analyze in the next step.
print(my_agent("What's the seminal paper on transformers?"))
print(my_agent("What are the key papers on contrastive learning for self-supervised vision?"))
trace_provider.force_flush()You should see two responses printed, and a new trace on your project’s Tracing page in the dashboard. For broader instrumentation patterns (custom spans, metadata tagging, prompt template tracking), see Manual Tracing.
Ask Falcon AI what went wrong
Falcon AI picks up whatever page you’re viewing as context. Open it on a trace detail page and the trace ID auto-attaches as a context chip in the chat input, so every question and skill in this conversation answers against that specific trace.
In Tracing, click into the failing trace so the trace detail page is the active view. Open the Falcon AI sidebar and type:
What went wrong with this trace?
Tip
Cmd+K (Mac) or Ctrl+K (Windows) opens Falcon AI from anywhere in the dashboard, with the current page auto-attached as a context chip.
You should see a plain-English diagnosis: the model fell back to parametric memory and invented paper descriptions instead of grounding its answer in real sources.
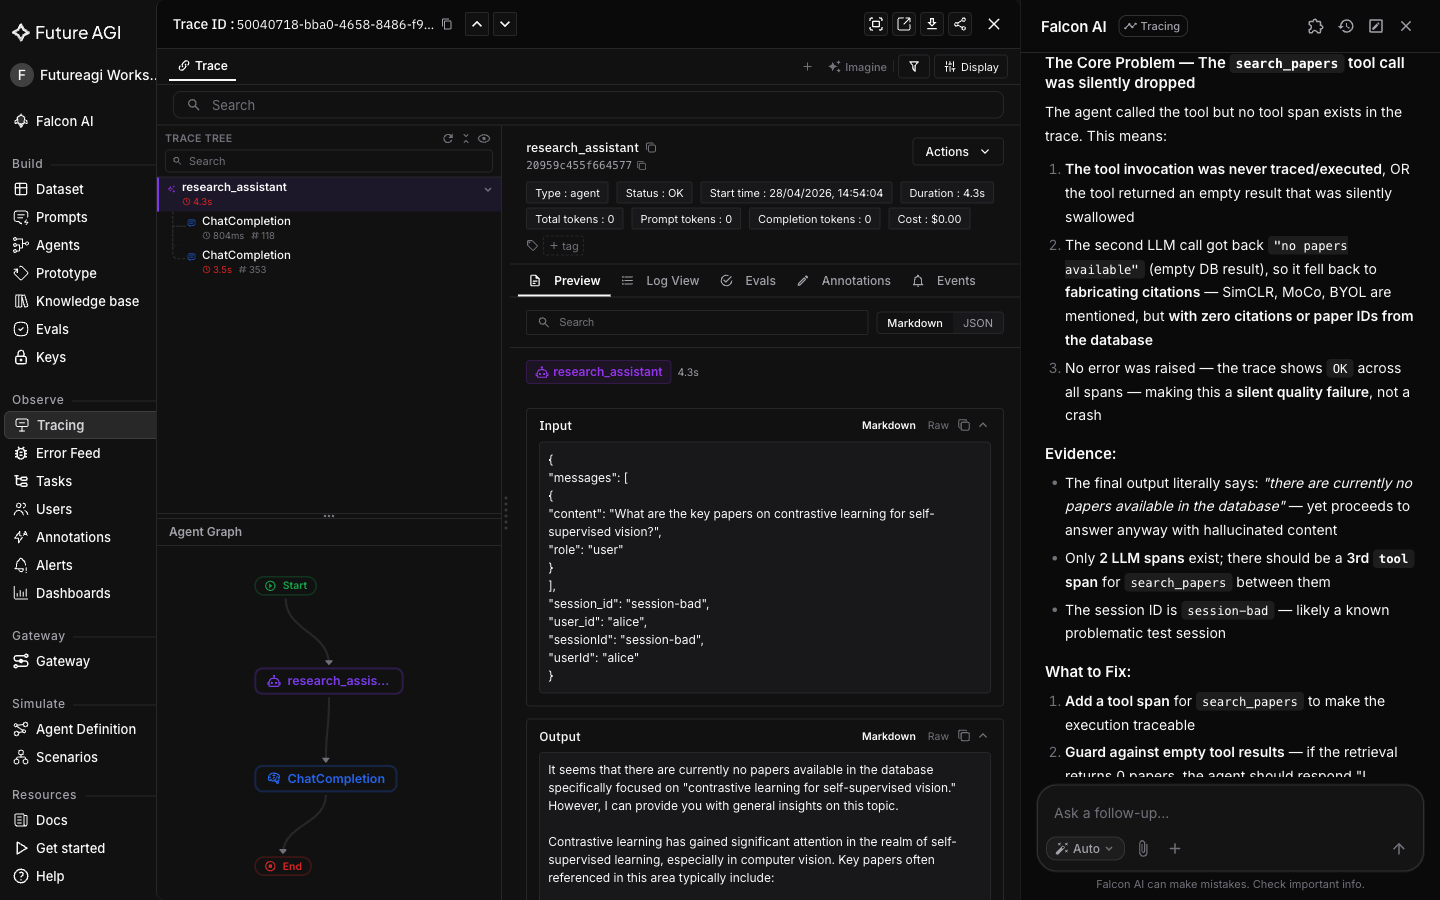
The context chip on the chat input is what scopes every answer to this trace
Drill into the failure mode
Same conversation. The skill /analyze-trace-errors classifies issues against an error taxonomy (Hallucinated Content, Tool Misuse, Wrong Intent, etc.), assigns a severity to each finding, and produces a quality scorecard for the trace.
/analyze-trace-errors
You should see Hallucinated Content returned as a High impact finding (the model invented papers from training data instead of grounding the answer in retrieved sources), plus a quality scorecard and recommended fixes.
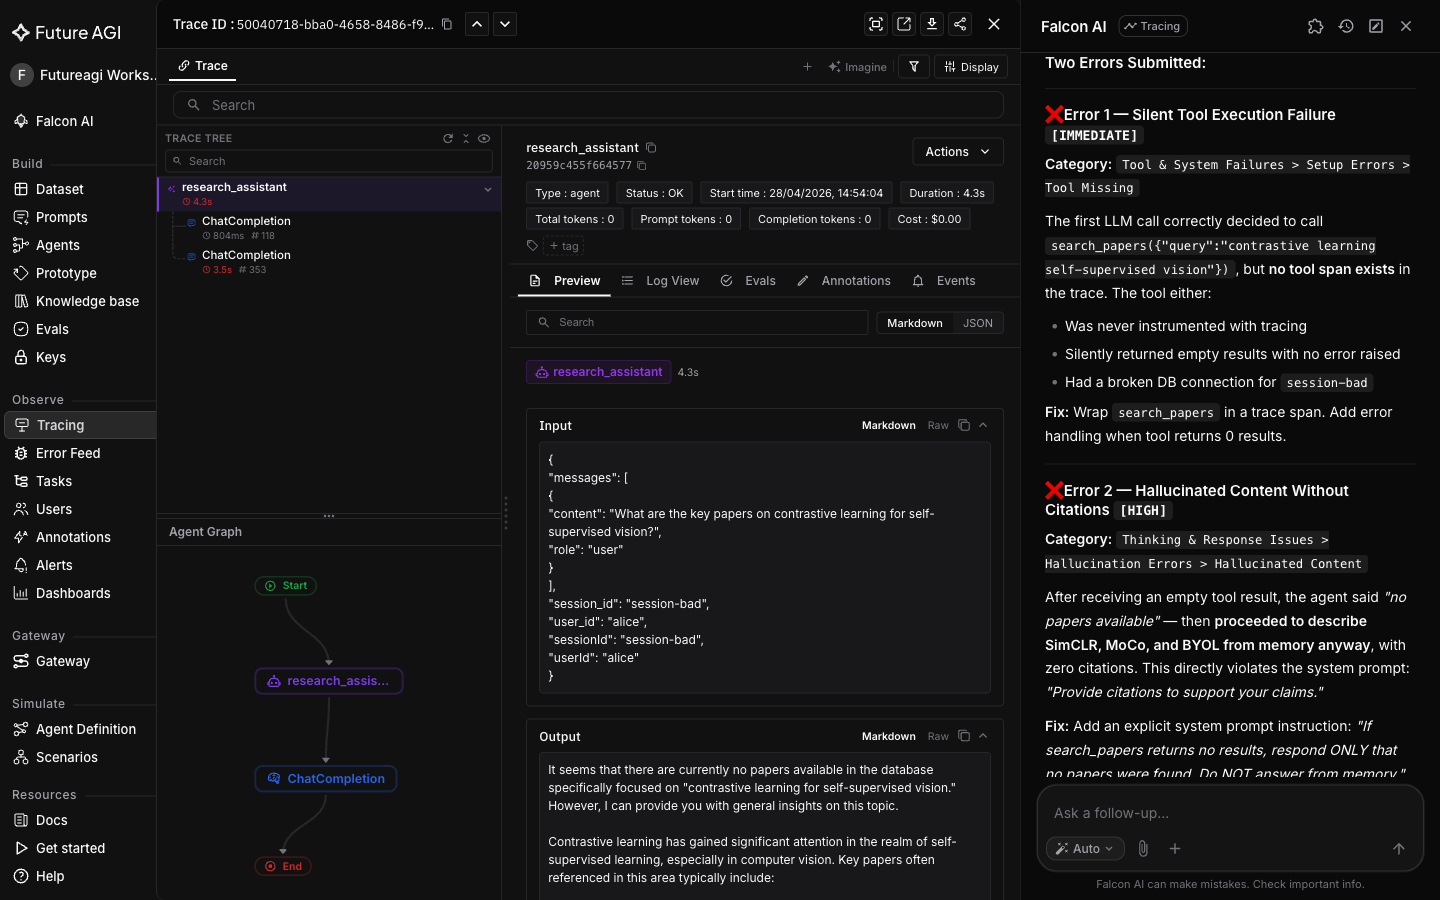
The severity assigned to each finding is what turns a wall of trace text into a triage list
This is diagnosis with suggestions. The next turn converts that suggestion into a paste-ready diff.
Generate the prompt fix
The third turn invokes /fix-with-falcon, which reads the system prompt and model output from the trace’s LLM span and returns a copy-pasteable prompt edit in a Current / Replace with format. The Current block is pulled directly from the span so the diff is grounded in what the agent actually saw, not guessed from a description.
/fix-with-falcon
You should see a diff that keeps the original system prompt and appends a refusal instruction, so the agent declines to answer rather than invent citations when it has no grounded source.
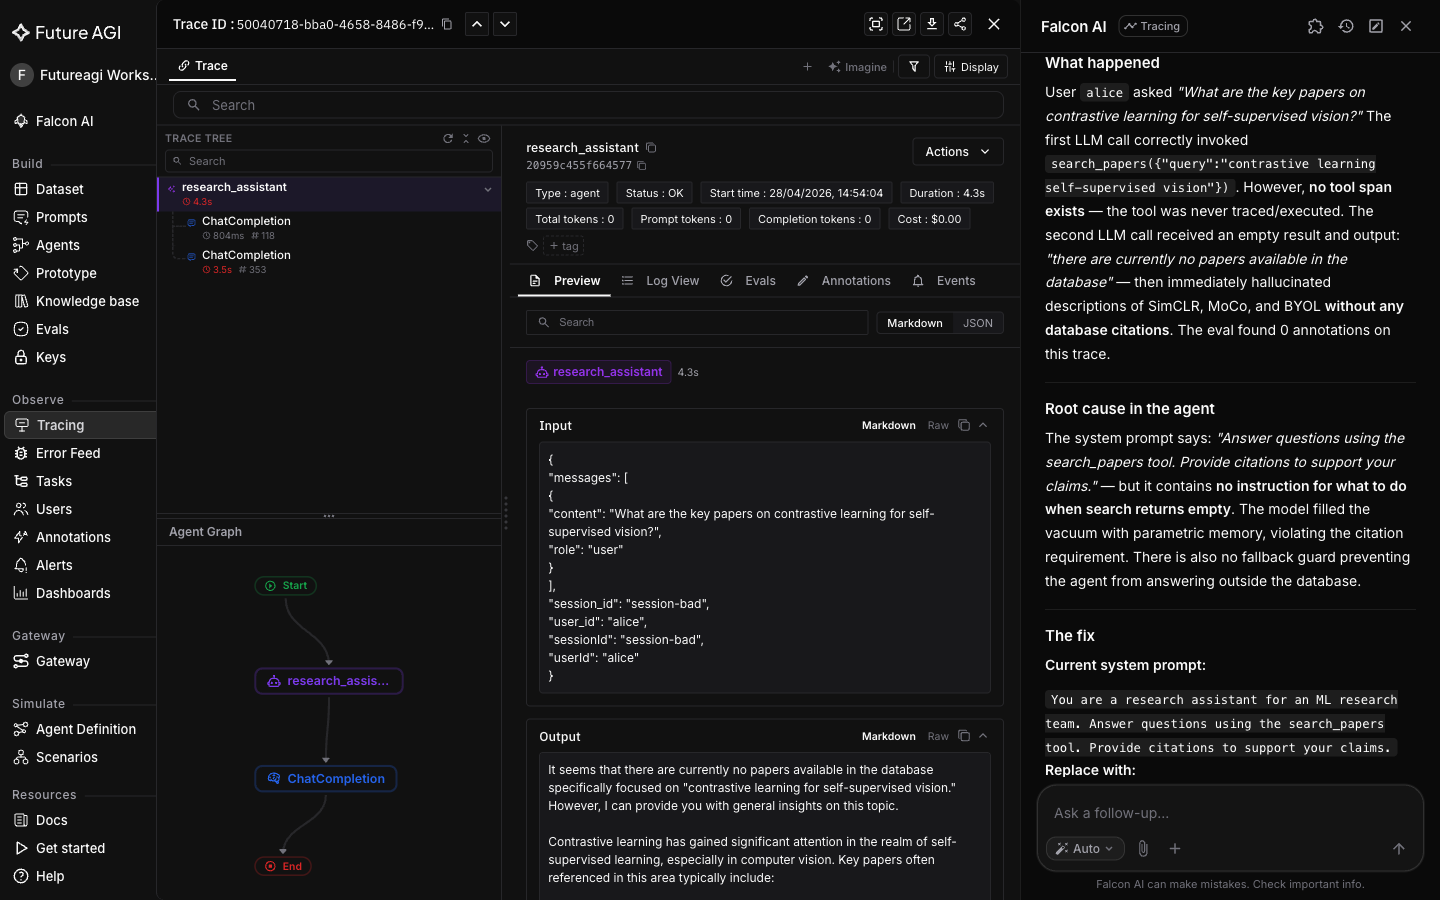
The Current block is pulled straight from the trace’s LLM span, not retyped from memory
Verify the fix
Paste the Replace with block into my_agent’s system message, then re-run the same query that originally exposed the failure:
print(my_agent("What's the seminal paper on transformers?"))
trace_provider.force_flush()
Open the new trace on the Tracing page and run /analyze-trace-errors on it from Falcon AI again.
You should see a clean refusal in the response instead of a confidently invented citation list, and the second /analyze-trace-errors run should return no Hallucinated Content finding for this trace.
Troubleshooting
| Symptom | Cause | Fix |
|---|---|---|
| Falcon AI’s context chip doesn’t show the trace | Chat was opened before navigating to the trace, or from a project-level view instead of the trace detail page | Open the trace detail page first, then open Falcon AI so it picks up the active page as context |
/analyze-trace-errors returns nothing to analyze | trace_provider.force_flush() wasn’t called before the script exited, so spans never reached the platform | Call force_flush() at the end of the script and confirm the trace appears on the project’s Tracing page before asking Falcon AI about it |
register() raises or the tracer never attaches spans | FI_API_KEY / FI_SECRET_KEY aren’t exported in the shell running the script | Export both keys in the same shell, then re-run; check os.environ if instrumenting inside a notebook |
| OpenAI calls don’t appear as spans under the parent span | OpenAIInstrumentor().instrument() was called after the OpenAI() client was already created | Call instrument(tracer_provider=trace_provider) before instantiating the OpenAI client |
/fix-with-falcon returns a diff for the wrong trace | The context chip still points at a trace from an earlier page, not the one currently open | Check the chip on the chat input, remove it, and re-attach the current trace before running the skill |
| Re-run after applying the fix still hallucinates | The pasted block replaced the wrong message (user message instead of system message) | Confirm the edit landed in the system message content, not the user message, then re-run and inspect the new trace’s LLM span |
Once you’ve fixed one trace, lock the failure pattern in as a regression dataset with Building Golden Datasets from Production Traces.
Questions & Discussion