Analytics & metrics
Judge a whole execution at once, then line several up against each other
Opening calls one at a time, the way Calls & transcripts does, tells you what happened in one conversation. It won’t tell you whether the agent is getting better. This guide covers the three places that will: a summary panel above the call table, an Analytics tab that scores one attempt as a whole, and a second Analytics tab that stacks attempts against each other.
All of it is scored by the evals attached to the run, so a run created without any will show these surfaces empty.
Execution-level or run-level
Start from Simulate in the sidebar, then Run Simulation, and click the run you want. You land on Simulated runs, which lists every attempt that run has made. Each attempt is an execution, and clicking one opens it.
That gives you two levels, and mixing them up is the easiest mistake to make here. An execution has its own summary and its own Analytics tab, answering “how did this attempt go”. The run that owns those executions has an Analytics tab of its own, answering “is this getting better than last time”.
Both tabs are called Analytics, so read what’s above them to tell which one you’re on: an execution’s tabs sit under an execution ID, and the run’s sit under the run’s name. A run only has more than one execution if it’s been started more than once, which is what Run New Simulation on the Simulated runs tab does.
Read Performance Metrics
Performance Metrics sits at the top of Call Details on a voice run, or Chat Details on a chat one, above the table of individual calls. It covers one execution, not one call, and it’s the fastest read on the page.
It groups into three panels. The first two differ by channel, because the two channels fail in different ways:
| Panel | Voice | Chat |
|---|---|---|
| Throughput | Calls placed, how many connected, connection rate | Chats started, how many completed, completion rate |
| System metrics | Pace and timing: latency, words per minute, how fast the agent stops when the caller cuts in, talk ratio | Cost and length: token counts, latency, turn count |
The third panel is the same on both: an average for each eval attached to the run.
Read the throughput panel first, because it can settle the question the eval scores can’t. A voice execution reporting 20 calls placed and 10 connected has a delivery problem, not a quality one, and no eval score is going to tell you that. Simulation FAQ & fixes covers what to do about calls that never connect.
An eval that returns a category rather than a percentage shows its split there instead, so a conversation-quality eval reads as its distribution across the calls rather than as one number. View all metrics expands the panel in place and flips to Minimize. The full field list for either channel is in Call metrics.
Score one execution
The execution’s Analytics tab takes the same evals and goes deeper. A radar chart plots every eval against each other, with each one’s score listed beside it, so a single weak axis stands out against the rest.
Each eval then gets its own card below. The Table and Column Chart toggle switches between reading that eval’s scores as numbers and reading them spread across percentile buckets, which is where you separate an eval that’s mediocre on every call from one that’s fine on most and falls apart on a few. The All selector on each card draws every scoring variant of that eval at once, or one at a time.
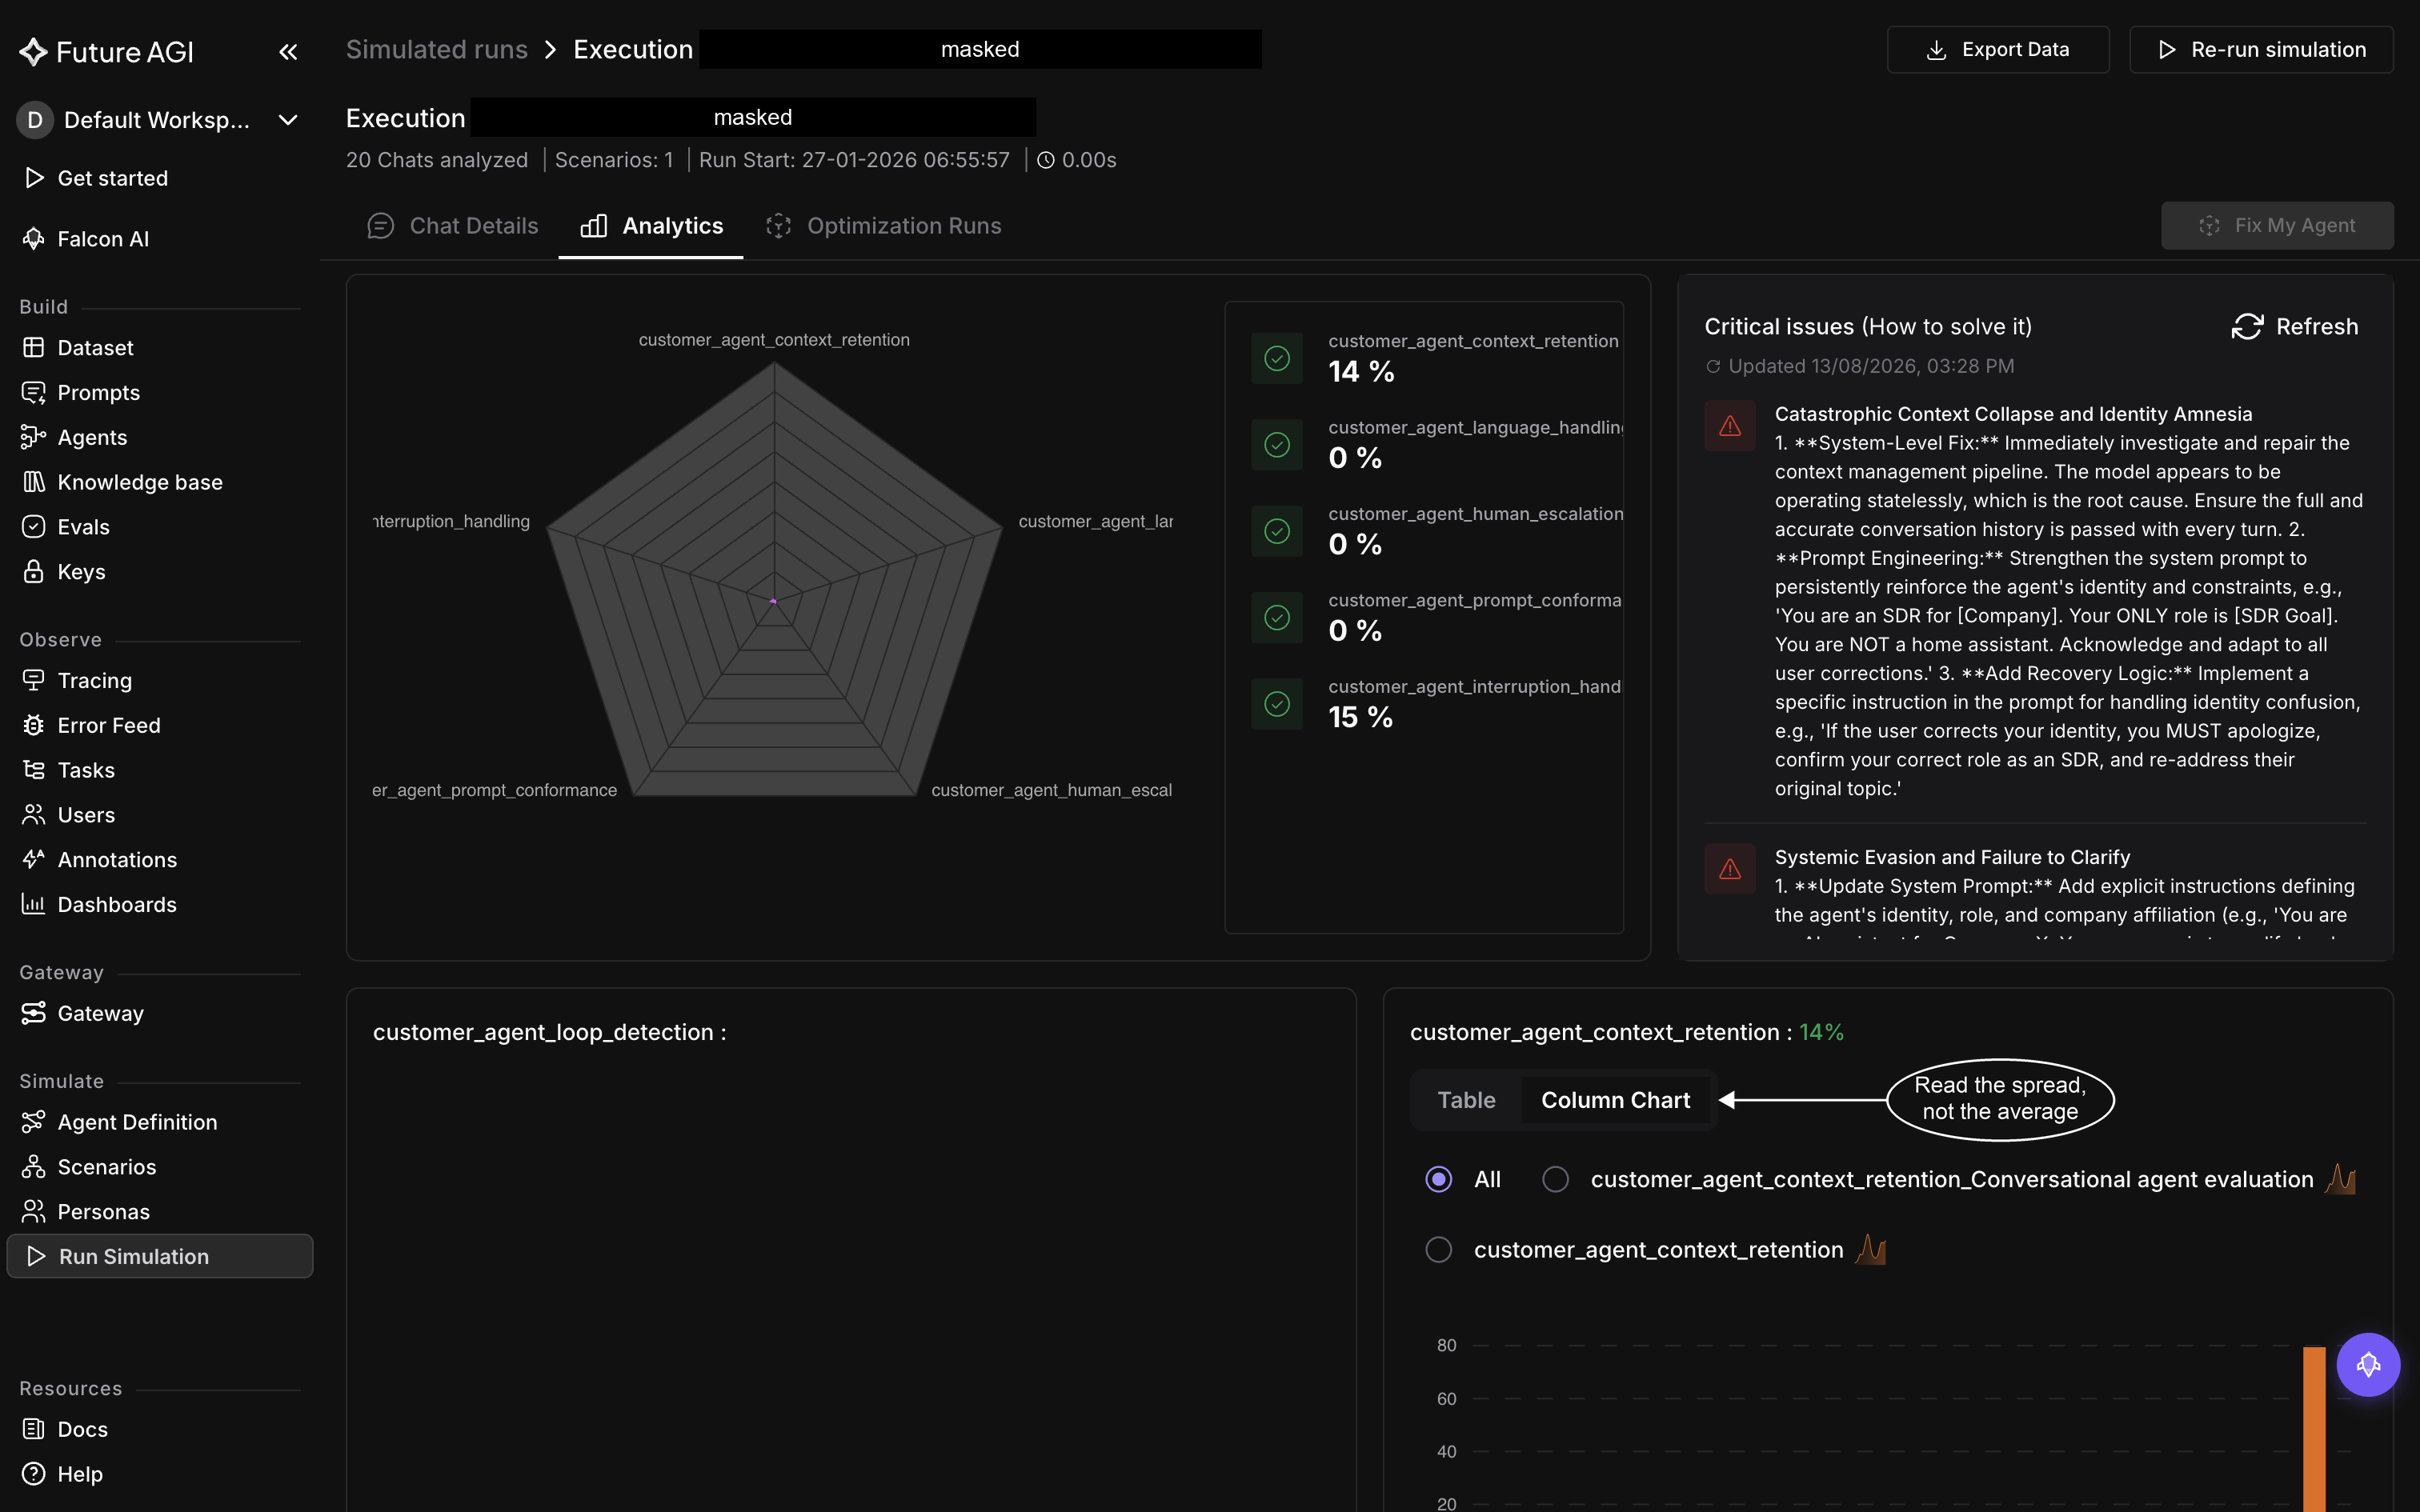
One execution’s Analytics tab. Context retention at 14% is the axis pulling the radar in
Critical issues (How to solve it) sits to the right of the radar. It names the failure patterns it found across this execution and gives numbered fixes for each, stamps when it last updated, and re-runs on Refresh. Generating it takes a few minutes, and it says so while it works. When it finds nothing it says that too: “Our analysis didn’t find any clusters of similar failures. This may mean issues are rare, inconsistent, or below the current threshold.” Fix My Agent is where findings turn into an actual change.
Compare executions
The run’s own Analytics tab is the one you reach from the run without opening any execution, and it’s where a regression shows up.
Check the execution list before you read anything into it. Executions (N) in the header opens a searchable checklist of every attempt, all ticked by default, and the Compare panel labels the ones you keep as A, B, C and so on, with A being the most recent. Attempts that failed before scoring stay in that list and report 0%, so a column of zeros beside one healthy execution usually means those attempts never ran rather than that the agent scored nothing.
Every eval then reports each execution’s score in one block, so a number that moved between two attempts is visible without opening either. The per-eval cards and the percentile view follow underneath, this time layered across the executions you kept ticked. Only eval scores are compared here; latency, tokens and connection rates stay on each execution’s own Performance Metrics panel.
Dive deeper
Questions & Discussion